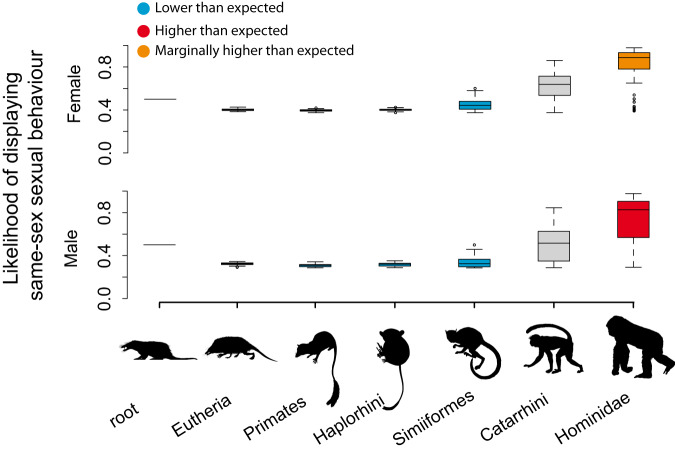
Fig. 2. Same-sex sexual behaviour from mammalian root to Hominidae.
Boxplots showing the likelihood estimation across 100 phylogenetic trees of the states of the most common recent ancestors (mrca) of the clades giving rise to the lineages of Hominidae (centre line, median; box limits, upper and lower quartiles; whiskers, minimum and maximum values). We used for the analysis the subset III. Red: significant probability (p < 0.05), according to a one-sided z-score test, of the ancestor displaying same-sex sexual behaviour; Orange: marginally significant probability of the ancestor of displaying same-sex sexual behaviour; Blue: significant probability of the ancestor of not displaying same-sex sexual behaviour; Grey: state of the ancestor was equivocal. For exact p-value see Table S8. The silhouettes illustrate the ancestors (downloaded from www.phylopic.org). They have a Public Domain license without copyright (http://creativecommons.org/licenses/by/3.0).

