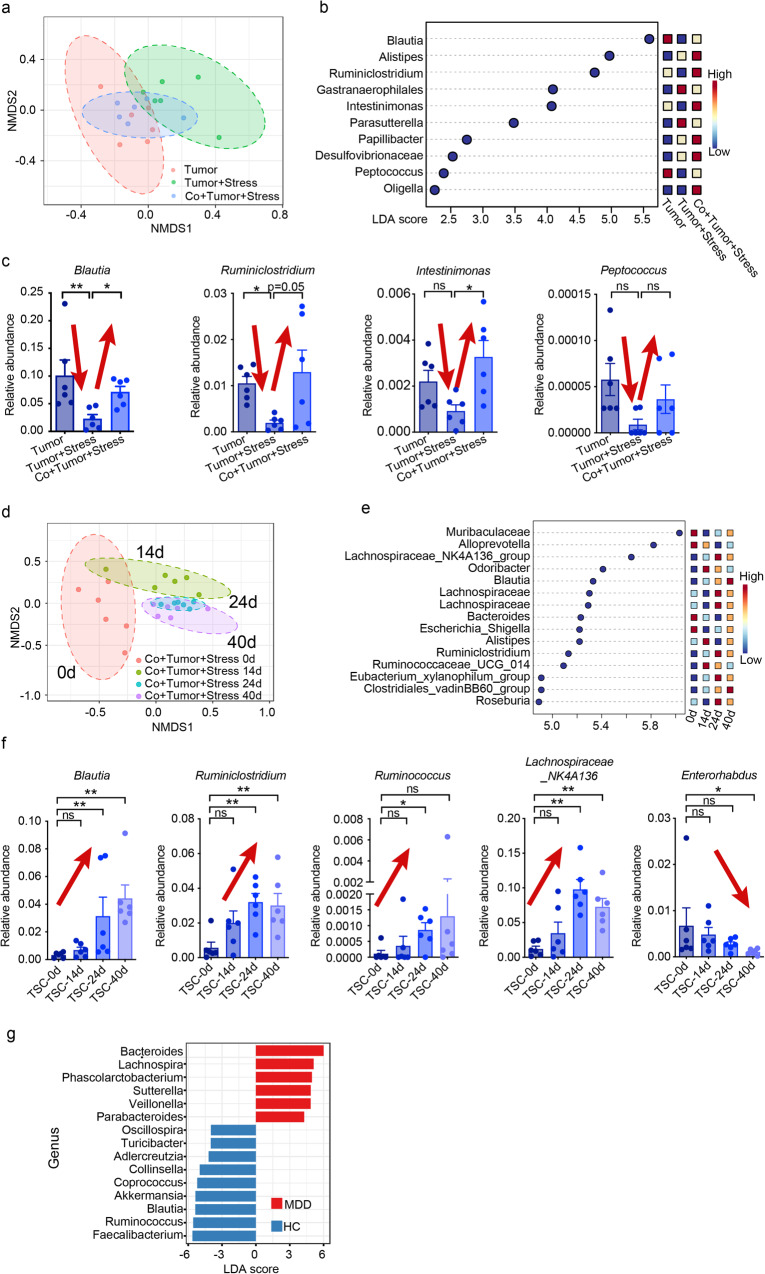
Fig. 3. Temporal and spatial interlacing analysis of gut microbiota.
a Non-metric multidimensional scaling (NMDS) plot of the cecal microbiota in non-stressed, stressed, and co-housed stressed tumor mice at the end of 40 days. b Linear discriminant analysis (LDA) score of differentially expressed genera obtained from the LEfSe analysis of cecal microbial abundance. Genera with LDA > 2 are listed. c Significant changes in the relative abundance at the genus level from the cecal microbiota in the co-housing experiments. d NMDS plot showing time-dependent changes in the fecal microbial composition of co-housed stressed tumor mice at 0, 14, 24, and 40 days. e LDA score of differentially expressed genera obtained from the LEfSe analysis of fecal microbial abundance of co-housed stressed tumor mice. Genera with LDA > 2.5 are listed. f Significant time-dependent changes in the relative abundance at the genus level from the fecal microbiota of co-housed stressed tumor mice (TSC). Data were presented as mean ± SEM, with n = 6 per group applied consistently across all panels (a–f). *p < 0.05 and **p < 0.01 indicate statistical significance determined by the c Kruskal–Wallis test and f two-tailed Mann–Whitney test, while “ns” indicates no significant difference. g LEfSe plot showing differentially abundant genera across MDD (n = 40) and HC (n = 30). Genera with Kruskal–Wallis ≤ 0.05, LDA > 2, and FDR < 0.05 are shown. Source data and exact p values are provided in the Source data file.

