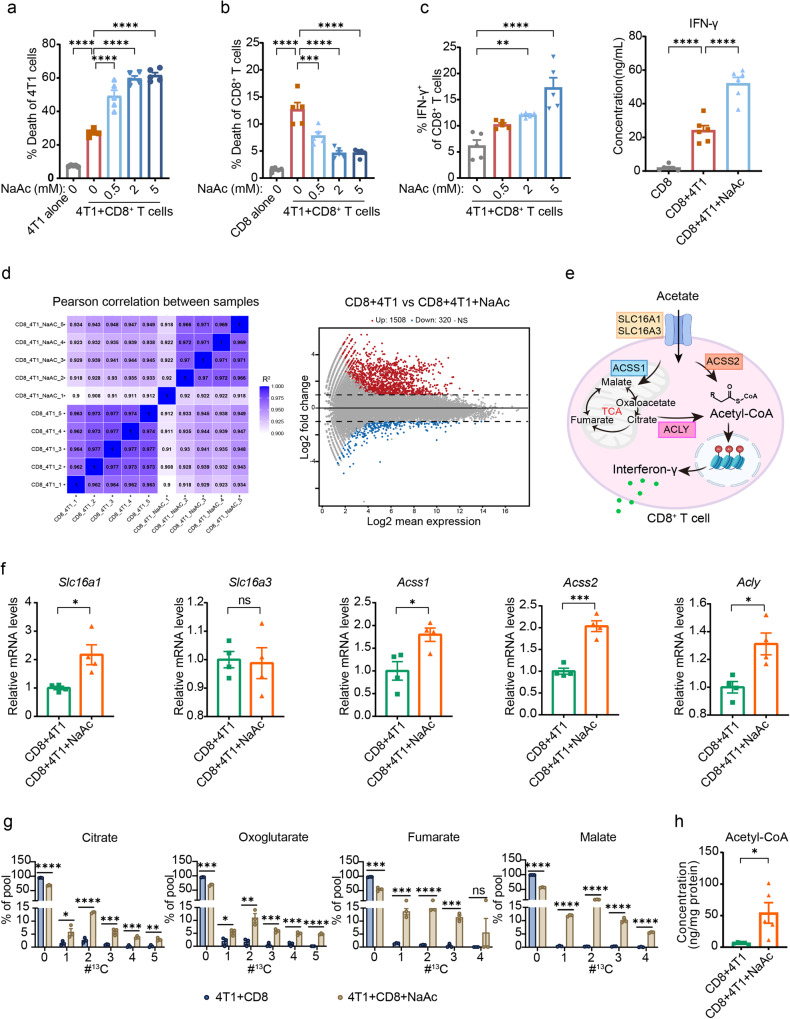
Fig. 7. Acetate enhances the activity CD8+ T cells by replenishing the acetyl-CoA pool during co-culture with cancer cells.
a Percentage of 4T1 cell death after co-culture with CD8+ T cells with or without NaAc (n = 5 per group). b Percentage of CD8+ T cell death after co-culture with 4T1 cells with or without NaAc (n = 5 per group). c Quantification of IFN-γ abundance in CD8+ T cells after NaAc treatment under co-culture with 4T1 cancer cells by flow cytometry (n = 5) or ELISA kit (n = 6). d Heatmap (left panel) and MA-plot (right panel) of control and acetate-exposed CD8+ T cells under co-culture with 4T1 cell transcriptome (n = 5 per group). e Pathway of acetate uptake and metabolism in CD8+ T cells. Created with BioRender.com. f mRNA expression of the solute carrier receptors Slc16a1, Slc16a3, Acss1, Acss2, and Acly in control and acetate-exposed CD8+ T cells under co-culture with 4T1 cells as determined by qPCR (n = 4 per group). g Metabolic isotopic tracing analysis of CD8+ T cells under co-culture with 4T1 cells after exposure to 13C-acetate. The x-axis shows the number of 13C per respective metabolite. Depicted are pooled data from two independent experiments with cells from n = 3 mice each. h Acetyl-CoA concentration in CD8+ T cell lysates after co-culture with 4T1 cells with or without acetate (n = 5 per group). Data were presented as mean ± SEM. Statistical significance was determined by one-way ANOVA followed by Dunnett’s multiple comparisons test for (a–c) and unpaired two-tailed Student’s t-test for (f–h). Significance levels are denoted as *p < 0.05; **p < 0.01; ***p < 0.001; ****p < 0.0001. “ns” means no significant difference. Source data and exact p values are provided in the Source data file.

