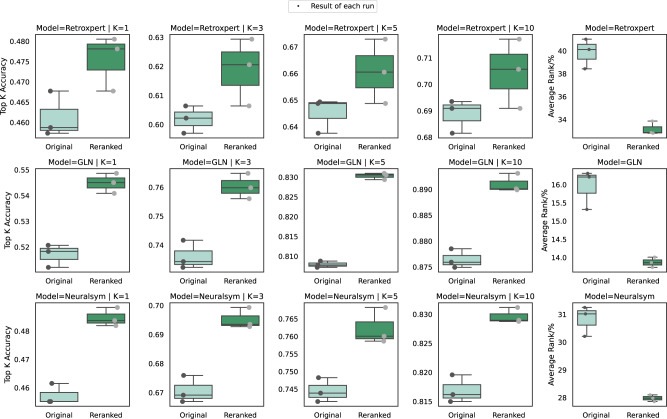
Fig. 4. Re-ranking performance of RetroExplainer.
The box plots depict re-ranking results in terms of top-1, -3, -5, -10 accuracy, and percentile average rank in comparison to three standard retrosynthesis models: Retroxpert, GLN, and Neuralsym. Each result was derived from three repeated experiments conducted with distinct random seeds. The minimum, maximum, and median of the three data points are represented by the lower whisker, upper whisker, and central line within each box, respectively. Source data are provided as a Source Data file.

