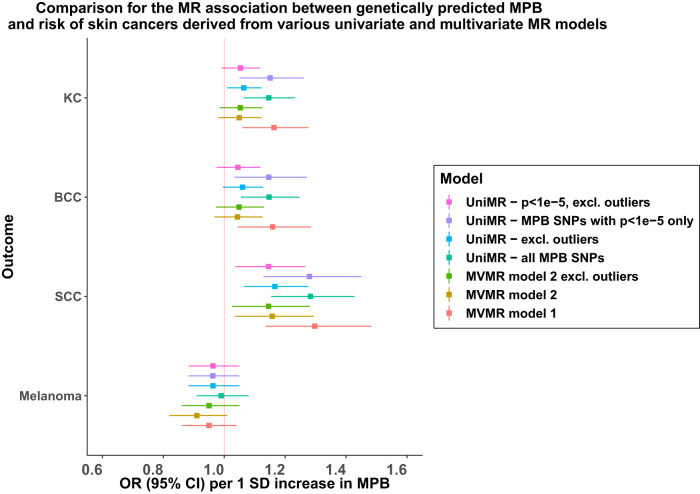
Fig. 3. Comparison of MR-derived association between MPB and various univariable and MVMR models.
UniMR − MPB SNPs with p < 1e − 5 only: Univariable MR model for MPB on skin cancer risks using on MPB SNPs with association (z-score) two-tailed P value < 1e-5 on MPB in the independent UK Biobank subset. UniMR − excl. outliers: Univariable MR model for MPB on skin cancer risks using all MPB SNPs excluding pleiotropic SNPs detected by MR-PRESSO. MVMR Model 1: MVMR model incorporating MPB, freeT and totalT. MVMR model 2: MVMR model incorporating MPB, totalT, skin colour and hair colour. The error bars reflect the 95% confidence intervals around each OR estimate. For all MVMR models, the reported OR estimates are the marginal OR estimates for skin cancer per 1 SD increase in MPB upon conditioning on the genetic effect sizes from other traits included in the model. Note that for MVMR model 2, including freeT into the model resulted in the weakening of the combined instrument for MVMR (conditional F-statistics<10 for some traits), which might result in weak instrument bias and hence were not included in the main analysis. However, these findings can be accessed in Supplementary Tables. Source data is provided as a Source Data file.

