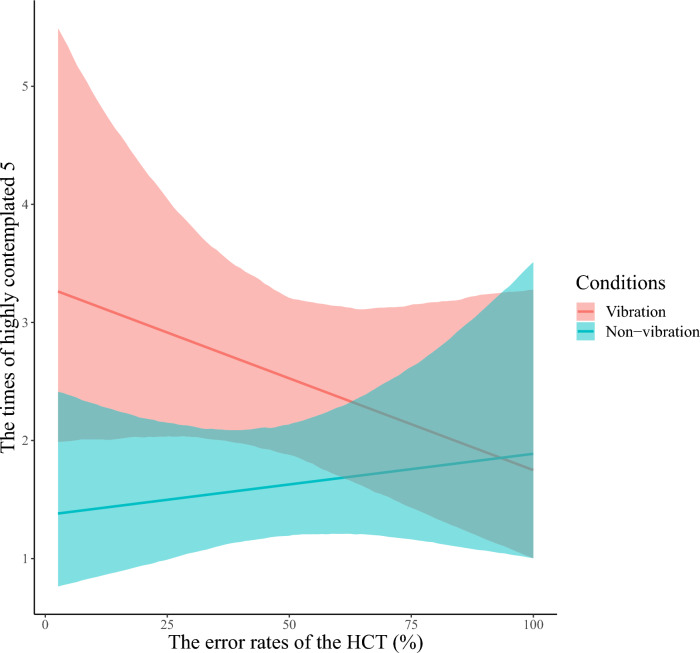
Figure 11.
The posterior predictive distribution of the relationship between the HCT error rates and the number of reported highly contemplated 5 for each vibration condition. We show the HCT error rates on the horizontal axis and the estimated number of highly contemplated 5 reports on the vertical axis. The colors indicate the conditions (vibration/non-vibration). The solid line on the graph shows the regression line based on the estimated values. Each colored range indicates 95% CI. Participants with the lower HCT error rates; that is, more accurate interoception, reported more highly contemplated 5 in the vibration block compared to the non-vibration block. Contrastingly, the lower the interoceptive accuracy, the smaller the difference in the frequency of reports of highly contemplated 5 between vibration conditions.

