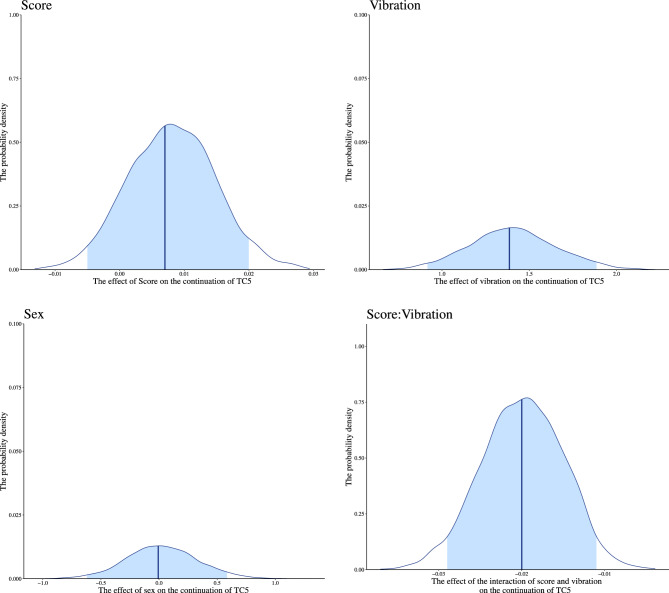
Figure 8.
Distribution of each estimated parameter in the continuation of TC5. We indicated the influence of each factor on the continuation of TC5 on the horizontal axis and the probability density on the vertical axis. The dark blue line shows the estimated coefficient, and the light blue range shows the 95% credible interval (CI). The lower limit of the 95% CI in main effect of vibration is higher than 0, and the higher limit in interaction of score and vibration is lower than 0. This indicates that these factors influence the continuation of TC5. The 95% CI of main effect of the HCT error rates and sex includes 0, indicating that these factors have little effect on the continuation of TC5.

