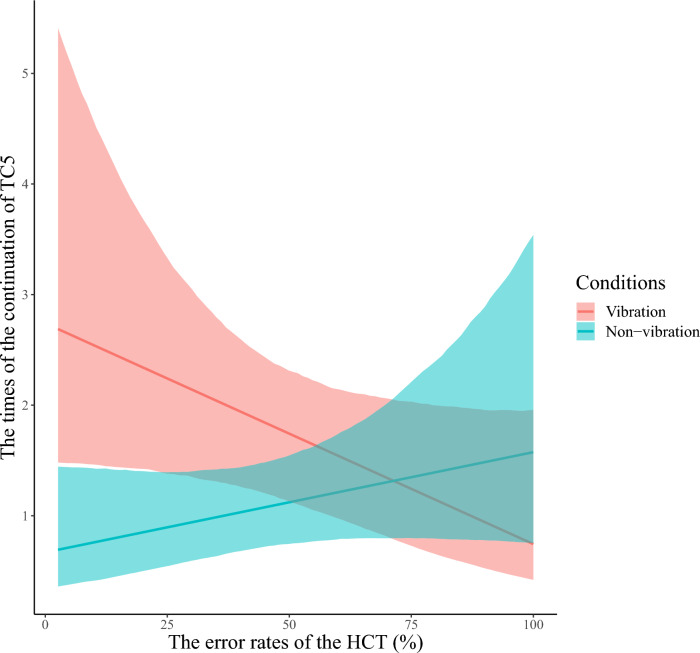
Figure 9.
The posterior predictive distribution of the relationship between the HCT error rates and the number of reported continuation of TC5 for each vibration condition. TC5 are reports of self-referential thoughts, such as past episodes and future plans regarding oneself. We show the HCT error rates on the horizontal axis and the estimated number of the continuation of TC5 reports on the vertical axis. The colors indicate the conditions (vibration/non-vibration). The solid line on the graph shows the regression line based on the estimated values. Each colored range indicates 95% CI. Participants with the lower HCT error rates; that is, more accurate interoception, reported a greater number of the continuation of TC5 in the vibration block compared to the non-vibration block. Contrastingly, the lower the interoceptive accuracy, the smaller the difference in the frequency of reports of the continuation of TC5 between vibration conditions.

