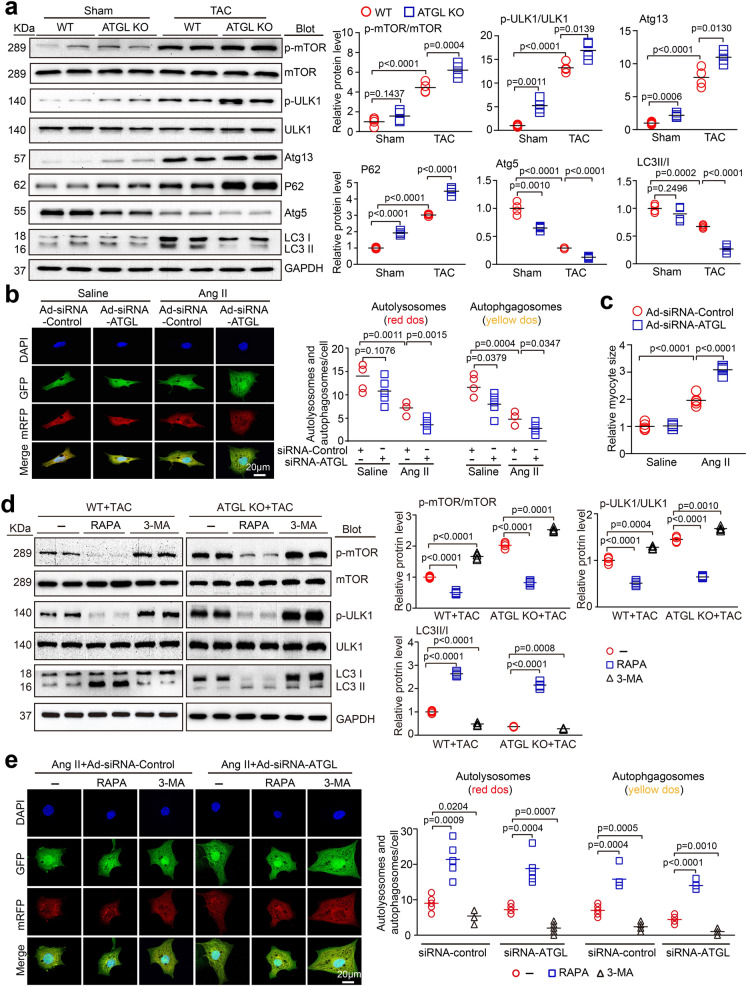
Fig. 4.
ATGL knockout enhances pressure overload-induced inhibition of autophagic signaling. a, WT and ATGL KO mice were subjected to sham or TAC operation for 4 weeks. Representative immunoblotting of p-mTOR, mTOR, p-ULK1, ULK1, Atg13, p62, LC3, Atg5, and GAPDH in the heart (left). Quantification of the relative protein levels (right, n = 4). b, Neonatal rat cardiomyocytes (NRCMs) were infected with adenovirus containing mRFP-GFP-LC3 together with Ad-siRNA-control or Ad-siRNA-ATGL and then treated with Ang II (100 nM) for 48 h. Immunofluorescence images (right) and the quantification of autophagosomes (yellow) and autolysosomes (red) in each condition (right, 15–20 cells per group) (n = 5 independent experiments). Scale bar: 20 μm. c, The quantification of cardiomyocyte size in each condition (right, 15–20 cells per group) (n = 5 independent experiments). Scale bar: 20 μm. d, WT and ATGL KO mice were subjected to TAC and co-treated with rapamycin (RAPA, 4 mg/kg daily) or 3-MA (10 mg/kg daily) for 4 weeks. Representative immunoblotting of p-mTOR, mTOR, p-ULK1, ULK1, and LC3 and GAPDH in the heart (left). Quantification of the relative protein levels (right, n = 4). e, NRCMs were infected with adenovirus containing mRFP-GFP-LC3 together with Ad-siRNA-control or Ad-siRNA-ATGL and then treated with Ang II (100 nM) in the presence of RAPA (20 nM) or 3-MA (5 mM) for 48 h. Immunofluorescence images (left) and the quantification of autophagosomes (yellow) and autolysosomes (red) in each condition (right, 15–20 cells per group) (n = 5 independent experiments). Scale bar: 20 μm. Data are presented as mean ± SEM, and n represents number of animals

