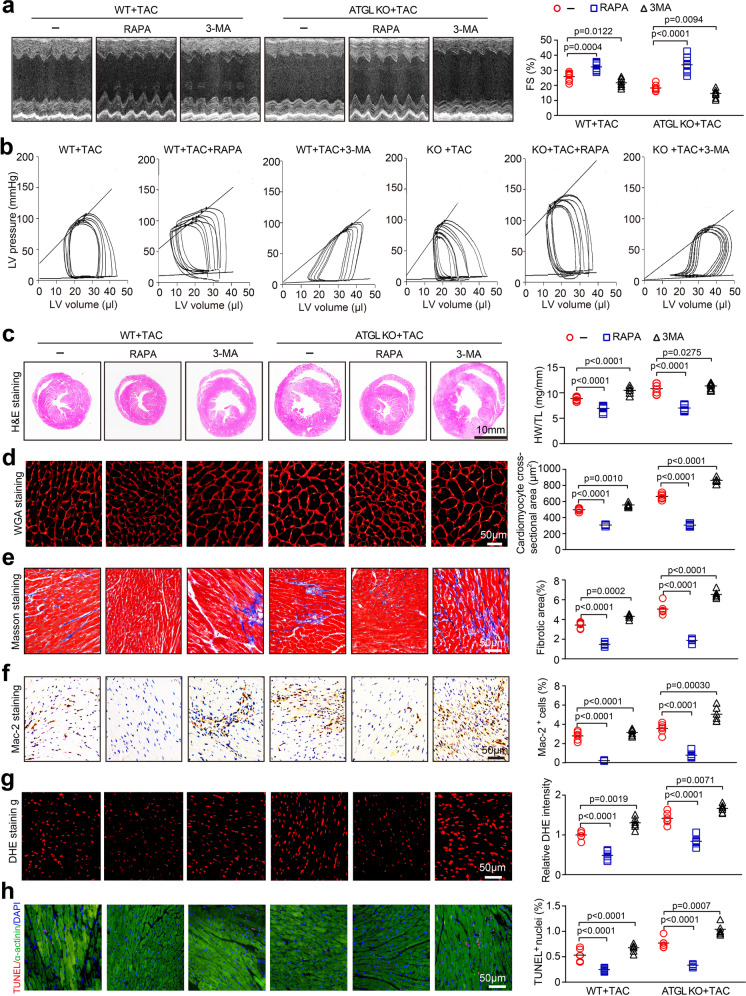
Fig. 5.
Autophagy mediates pressure overload-induced cardiac hypertrophic remodeling and dysfunction in ATGL KO mice. a, WT and ATGL KO mice were subjected to TAC and co-treated with RAPA (4 mg/kg daily) or 3-MA (10 mg/kg daily) for 4 weeks. Echocardiographic measurement of LV chamber (left), and the calculation of LV FS% (right, n = 8). b, Pressure–volume analysis of systolic and diastolic function. Representative LV P–V loop in each group. c, Representative H&E images of heart sections (left). Scale bar: 10 mm. The ratio of HW/TL (right, n = 6). d, TRITC-labeled WGA staining to measure cardiac myocyte size (left). The Quantification of cross-sectional area of myocytes (right, n = 6,150–200 cells counted per sample). Scale bar: 50 μm. e, Masson’s trichrome staining of heart sections (left), and quantification of fibrotic area (right, n = 6). Scale bar: 50 μm. f, Immunohistochemical staining of heart sections with anti-Mac-2 antibody (left). The percentage of Mac-2-positive macrophages (right, n = 6). Scale bar: 50 μm. g, DHE staining of heart sections (left), and quantification of the relative superoxide production (right, n = 6). Scale bar: 50 μm. h, Staining of sections for TUNEL (red), α-actinin (green) and DAPI (blue) (left). Quantification of the TUNEL-positive nuclei (right, n = 6). Scale bar: 50 μm. Data are presented as mean ± SEM, and n represents number of animals

