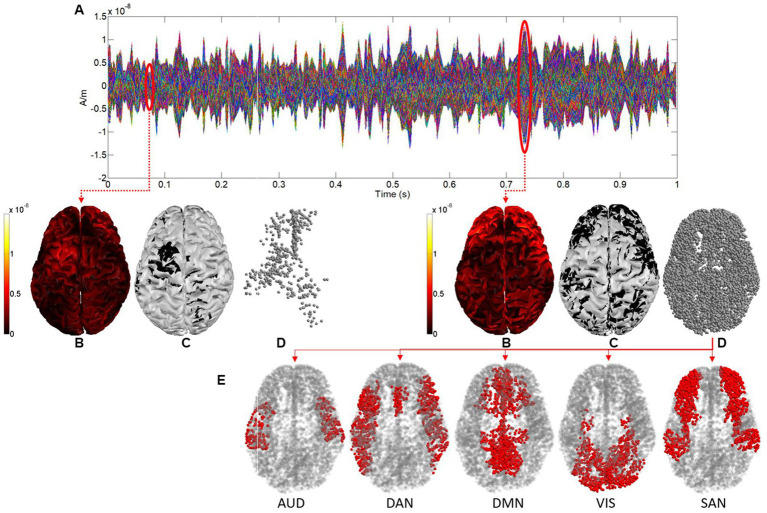
Figure 1.
(A) Sources activity for 1 s. (B) Representation in 3D of the sources activity at two different time samples (0.06 and 0.73 s respectively). (C) 3D representation after binarization. (D) Point clouds defined by sources after binarization (cortical activations). (E) Cortical activations in each functional network (shown for the time sample of 0.73 s).

