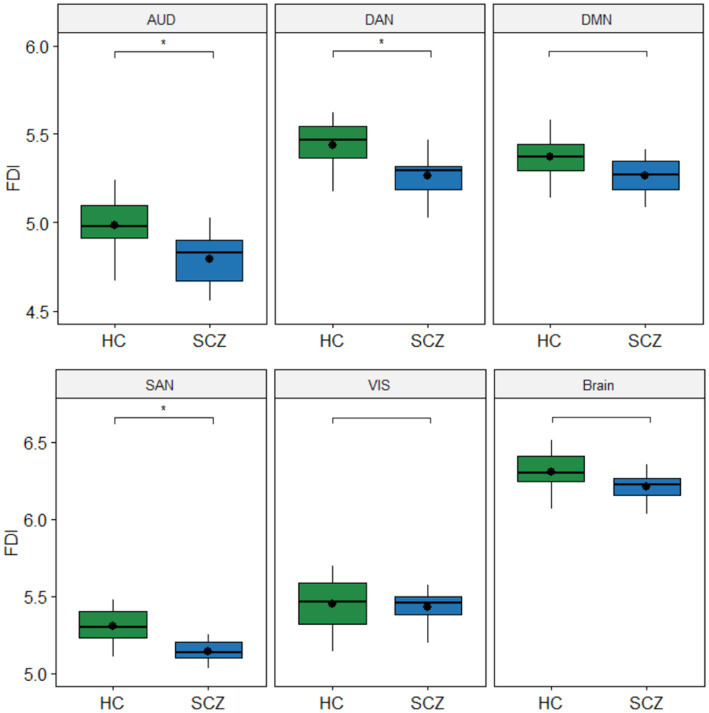
Figure 4.
Boxplots with differences in fractal dimension index (FDI) between groups. The FDI values in each group are the average of the 150 FDI values computed for each subject in the corresponding network. Values of p for the Quade’s ANCOVA test controlling for age, gender, and education (*p < 0.05). Values of p were corrected for multiple comparisons with the Bonferroni post hoc method. No significant differences were found between groups for the whole Brain nor the DMN and VIS networks.

