Figure 7.

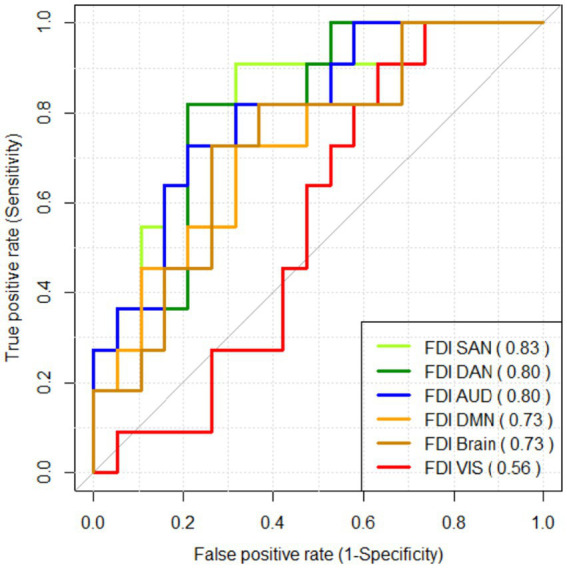
ROC curve analysis assessing the performance of FDI as a classifier for schizophrenia. The AUC value for each FDI measure is shown between brackets.

ROC curve analysis assessing the performance of FDI as a classifier for schizophrenia. The AUC value for each FDI measure is shown between brackets.