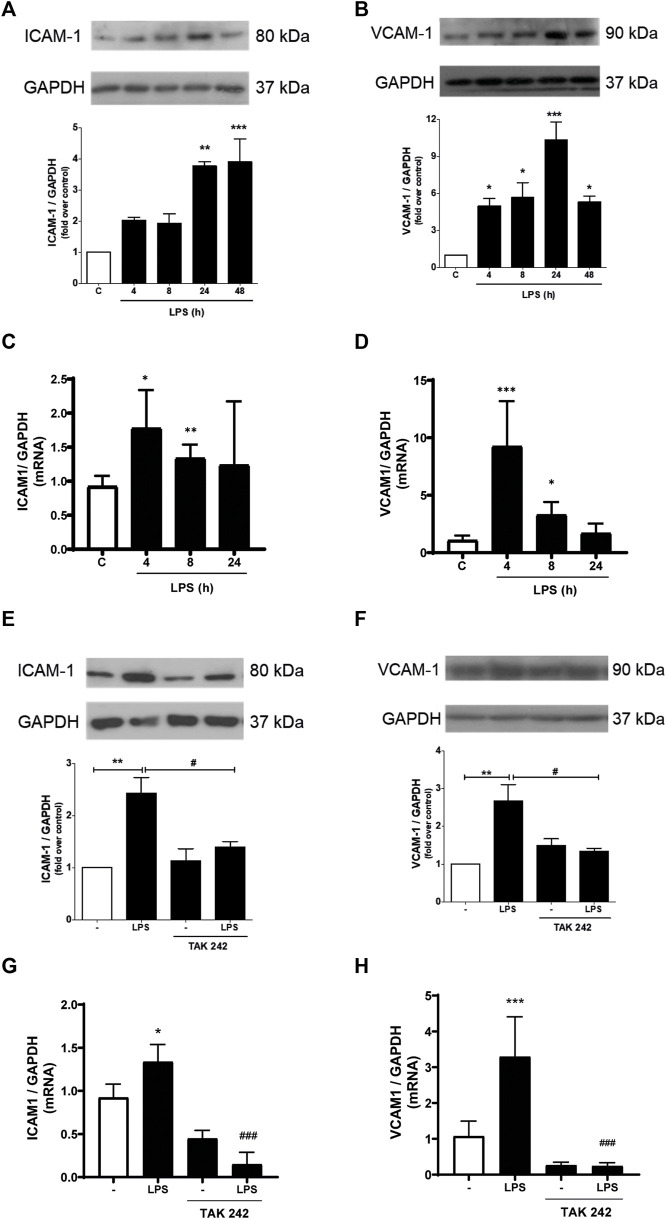
FIGURE 2.
LPS induces ICAM-1 and VCAM-1 expression in cardiac fibroblasts (CF) thorough TLR4. (A, B) CF were stimulated with LPS (1 μg/ml) for 4, 8, 24 and 48 h, and then the expression of ICAM-1 (A) and VCAM-1 (B) was analyzed by WB. A representative image of the experiment is shown in the upper panel and its quantification, in the lower panel. (C, D) CF were stimulated with LPS (1 μg/ml) for 4, 8, and 24, and then the mRNA expression of ICAM-1 (C) and VCAM-1 (D) was analyzed by RT-qPCR. (E, F) CF were pre-stimulated with the TLR4 inhibitor TAK-242 (4 uM) for 1 h and subsequently stimulated with LPS (1 μg/ml) for 24 h for the subsequent analysis of ICAM-1 (C) and VCAM-1 (D) protein expression by WB. A representative image of the experiment is shown in the upper panel and its quantification, in the lower panel Proteins were analyzed by Western Blot. GAPDH was used as a loading control. (G) and (H) CF were pre-stimulated with the TLR4 inhibitor TAK-242 (4 uM) for 1 h and subsequently stimulated with LPS (1 μg/ml) for 8 h for the subsequent analysis of ICAM-1 (C) and VCAM-1 (D) mRNA expression by RT-qPCR. ***p < 0.001; **p < 0.01; *p < 0.05 vs. control; #p < 0.05 vs. LPS. Results are expressed as mean ± SEM. (n = 3).

