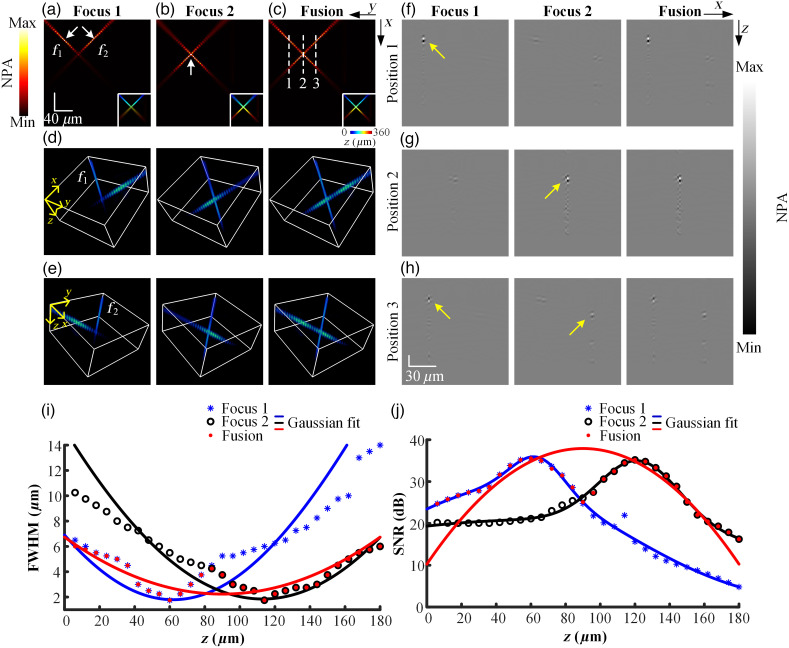
Fig. 4.
(a), (b) MAP images of multi-focus fiber data. (c) MAP image of the fiber fused through the proposed method. The depth-coding MAP images of (a)–(c) are presented in the lower right corner, respectively. (d), (e) 3D visualization of the multi-focus fiber from two views, respectively. and are the two vertically tilted fibers. (f)–(h) B images of the white dashed lines in panel (c) before and after fusion. (i) Variation of FWHM along with the depth before and after fusion. (j) Variation of SNR along with the depth before and after fusion. NPA, normalized photoacoustic amplitude.

