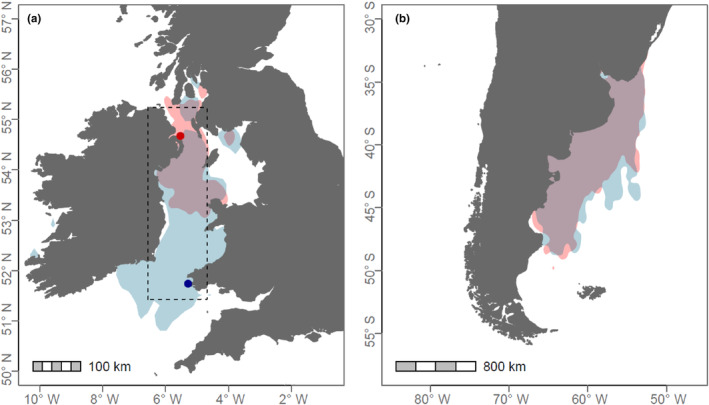
FIGURE 1.

Manx shearwaters breeding on Copeland (red) and Skomer Island (blue) demonstrate a strong spatial overlap in foraging habitat use during the (a) breeding season and (b) overwintering period. Dashed grid square in panel (a) shows the area used to extract summer wind speed data. Figure adapted from Dean et al. (2015) and Kirk (2017). Kernel densities were calculated using 90% occupancy and (a) 35 birds for Copeland and 69 birds for Skomer Island, and (b) 13 birds for Copeland and 26 birds for Skomer Island.
