
FIGURE 4.
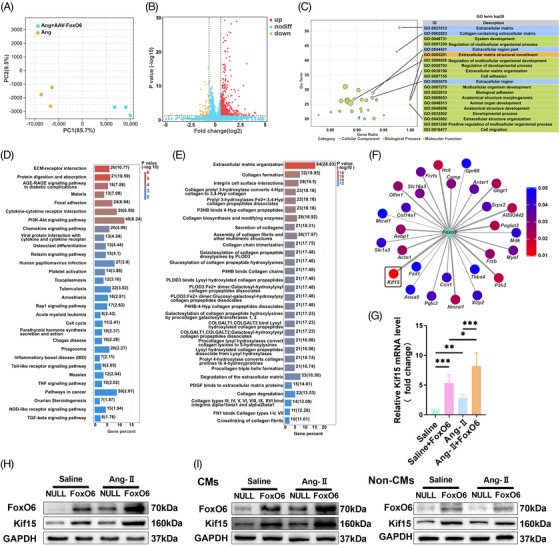
Overexpression of Forkhead box protein O6 (FoxO6) activated extracellular matrix remodeling and upregulated Kif15 expression. (A) Principal component analysis (PCA) of angiotensin‐II (Ang‐II) and Ang‐II + adeno‐associated virus (AAV)‐FoxO6 groups. (B) Volcano map showing great differences in gene expression pattern between Ang‐II and Ang‐II + AAV‐FoxO6 groups. (C) Gene Ontology (GO) enrichment analysis of top 20 differentially expressed genes (DEGs). (D) Pathways significantly enriched in myocardial tissue after FoxO6 overexpression. (E) Reactome analysis of significantly enriched reactions in myocardial tissue after FoxO6 overexpression. (F) Kif15 is gene with most significant increases in expression level. (G) Cardiac mRNA expression levels of gene encoding Kif15 (n = 6). (H) Cardiac protein expression levels of FoxO6 and Kif15 levels in murine myocardium (n = 6). (I) Cardiac protein expression levels of FoxO6 and Kif15 in cardiomyocytes (CMs) and non‐CMs from murine myocardium (n = 6). Data were analyzed by one‐way analysis of variance (ANOVA). * p < 0.05, ** p < 0.01, *** p < 0.001, **** p < 0.0001. Statistics are carried out as mean ± standard deviation (SD).