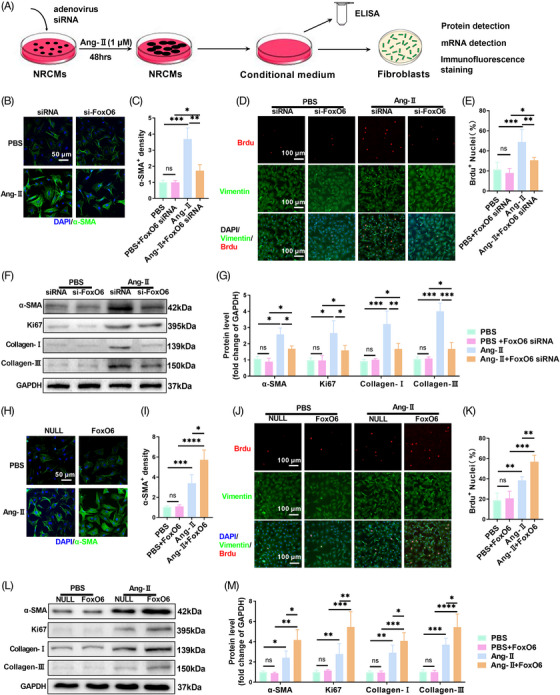
FIGURE 6.

Give‐and‐loss function of Forkhead box protein O6 (FoxO6) in neonatal rat cardiomyocytes (NRCMs) regulated expression of transforming growth factor‐β1 (TGF‐β1) in culture medium and proliferation and differentiation of fibroblasts. (A) In vitro model: under angiotensin‐II (Ang‐II) stimulation, expression of FoxO6 in cardiomyocytes (CMs) was regulated, concentration of TGF‐β1 in culture medium of CMs in each group was detected, and same culture medium of each group was added to corresponding batch of fibroblast culture dishes to observe changes in each group. (B) Immunostaining of fibroblasts to exhibit the expression of α‐SMA (green). (C) α‐SMA immunofluorescence intensity (n = 5 samples per group). (D) Immunostaining of fibroblasts to exhibit the expression of vimentin (green), BrdU (red), and DAPI (blue). (E) Number of BrdU‐positive nuclei (n = 5). (F) Typical western blots indicating α‐SMA, Ki67, collagen I, and collagen III in fibroblasts. (G) FB protein expression levels of α‐SMA, Ki67, collagen I, and collagen III (n = 6). (H) Immunostaining of fibroblasts to exhibit the expression of α‐SMA (green). (I) α‐SMA immunofluorescence intensity (n = 5). (J) Immunostaining of fibroblasts to exhibit the expression of vimentin (green), BrdU (red), and DAPI (blue). (K) Number of BrdU‐positive nuclei (n = 5). (L) Typical western blots indicating α‐SMA, Ki67, collagen I, and collagen III in fibroblasts. (M) FB protein expression levels of α‐SMA, Ki67, collagen I, and collagen III (n = 6). Data were analyzed by one‐way analysis of variance (ANOVA). * p < 0.05, ** p < 0.01, *** p < 0.001, **** p < 0.0001. Statistics are carried out as mean ± standard deviation (SD).
