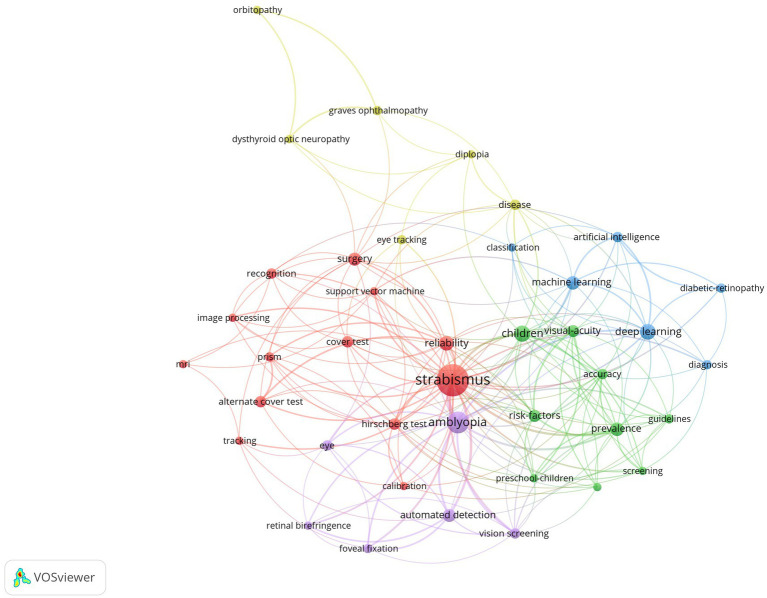
Figure 4.
The co-occurrence map of keywords. It reveals 5 clusters (in 5 colors): the diagnosis of strabismus (in red), diseases related to strabismus (in yellow), terms related to AI (in blue), terms related to epidemiology (in green) and technical key point (in purple). Each node represents one keyword. The number of occurrences determines the size of the circle. Connecting lines represent co-occurrence between different keywords.

