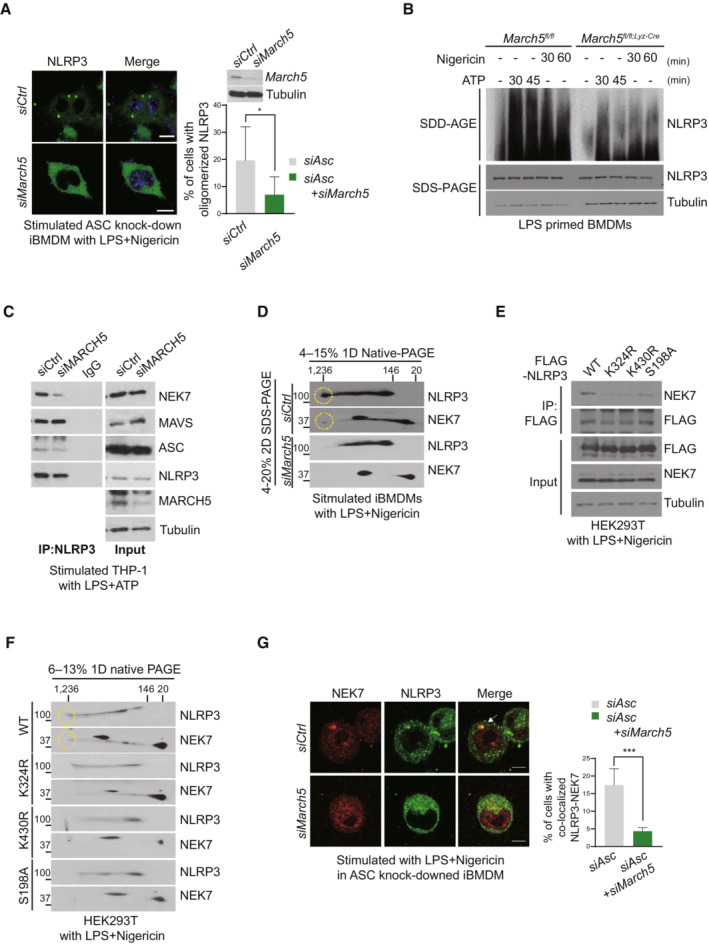
Figure 6. MARCH5‐dependent NLRP3 ubiquitination allows the binding of NEK7 to NLRP3.

-
ARepresentative confocal images of oligomerized NLRP3. ASC knock‐downed immortalized BMDMs expressing GFP‐tagged NLRP3 WT were transfected using indicated siRNAs, and treated with 200 ng/ml LPS for 4 h followed by 15 μM nigericin for 30 min. White arrows indicate oligomerized NLRP3. The percentage of cells with oligomerized NLRP3 was quantified. At least 100 cells were analyzed. Bar, 10 μm. Values are the mean ± SD. *P < 0.05 (two‐tailed Student's t‐test).
-
BMarch5 fl/fl and March5 fl/fl;Lyz‐Cre BMDMs were stimulated for 4 h with LPS followed by 5 mM ATP or 15 μM nigericin for the indicated durations. SDD–AGE and SDS–PAGE were performed to separate cell lysates, followed by immunoblotting using indicated antibodies.
-
CTHP‐1 cells transfected with siControl or siMARCH5 were stimulated with 200 ng/ml LPS for 4 h followed by 5 mM ATP for 30 min. Cell lysates were subjected to immunoprecipitation by using NLRP3 antibody. Western blotting was performed using the indicated antibodies.
-
DImmortalized BMDMs were transfected with siControl or siMARCH5 and stimulated with LPS and nigericin. Blue native PAGE was used first to separate the cell lysates, and then SDS–PAGE was used to separate them further. Western blotting was performed using the indicated antibodies. Each yellow circle represents the oligomerized form of indicated protein.
-
EHEK293T cells were transfected with FLAG‐tagged NLRP3 WT or indicated mutants and stimulated with LPS and nigericin. Cell lysates were immunoprecipitated with FLAG‐M2 beads and detected with the indicated antibodies.
-
FHEK293T cells were transfected with FLAG‐tagged NLRP3 WT or indicated mutants. Cells were stimulated with LPS and nigericin. Cell lysates were separated by blue‐native PAGE (first dimension) and SDS–PAGE (second dimension). Representative data from independent experiments that were repeated at least three times are shown. Each yellow circle represents the oligomerized form of indicated protein.
-
GRepresentative confocal image showing NLRP3‐NEK7 colocalization. siControl‐ and siMarch5‐ transfected ASC knock‐downed iBMDMs expressing GFP‐tagged NLRP3 WT cells were stimulated with 200 ng/ml LPS for 4 h followed by 15 μM nigericin for 30 min. The percentage of cells with NLRP3‐NEK7 colocalization was quantified. At least 100 cells were analyzed. Values are shown as the mean ± SD. ***P < 0.001 (two‐tailed student's t‐test). See also Appendix Figure S1. Bar, 10 μm.
Source data are available online for this figure.
