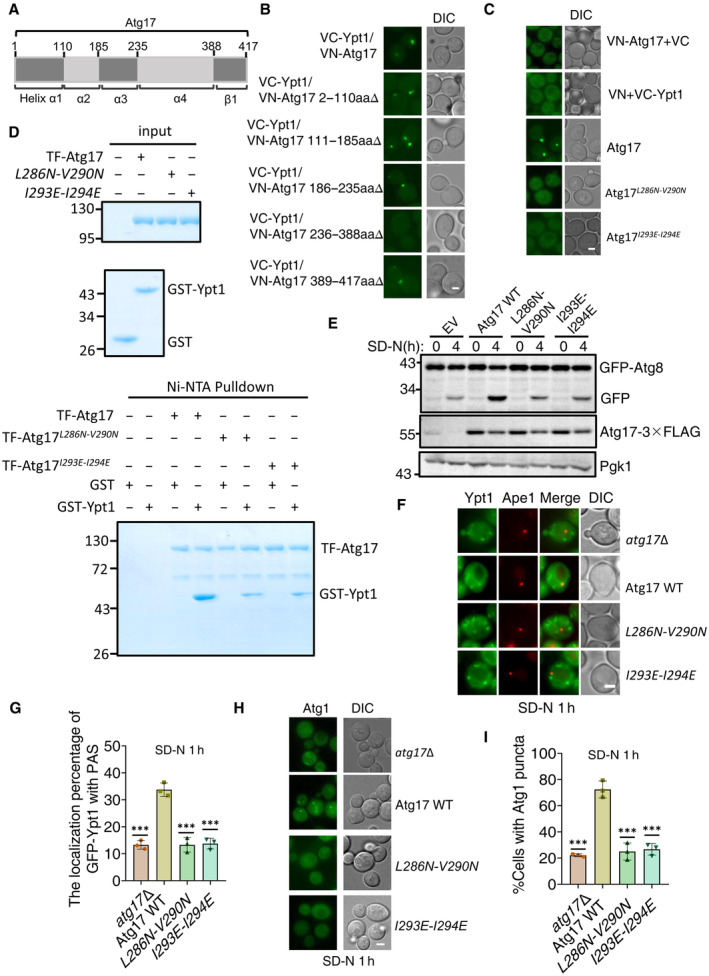
Figure 5. Ypt1‐Atg17 binding is required for autophagy.

-
AThe scheme for the Atg17 domains.
-
B, CFluorescence microscopy images of wild‐type cells expressing the BiFC constructs VC‐Ypt1 and Atg17‐VN or the indicated Atg17‐VN variants cultured in nutrient‐rich medium. Scale bar: 2 μm.
-
DNi‐NTA pulldowns were performed by using purified His6‐tagged TF‐Atg17 variants with GST, or GST‐Ypt1 from E. coli. Protein samples were separated by SDS‐PAGE, and then detected using Coomassie blue staining.
-
Eatg17∆ yeast strains co‐expressing GFP‐Atg8, Vph1‐mCherry and empty vector, wild‐type Atg17(Atg17 WT), or the indicated Atg17 mutant plasmids were cultured in SD‐N medium for 0 or 4 h. The autophagic activity of cells were analyzed by western blot for GFP‐Atg8 cleavage. Pgk1 served as a loading control.
-
F, Gatg17∆ yeast strains co‐expressing GFP‐Ypt1, RFP‐Ape1 and empty vector, wild‐type Atg17(Atg17 WT), or the indicated Atg17 mutant plasmids were cultured in SD‐N medium for 1 h. Images of cells were obtained using inverted fluorescence microscopy. Scale bar, 2 μm. Cells were quantified for the number of cells in which GFP‐Ypt1 colocalized with RFP‐Ape1 puncta. n = 300 cells were pooled from three independent experiments. Data are shown as mean ± SD. ***P < 0.001; two‐tailed Student's t‐tests were used.
-
H, Iatg17∆ yeast strains co‐expressing Atg1‐GFP and empty vector, wild‐type Atg17(Atg17 WT), or Atg17 mutant plasmids were cultured in SD‐N medium for 1 h. Images of cells were obtained using the inverted fluorescence microscopy. Scale bar, 2 μm. Cells were quantified for the number of cells in which Atg1‐GFP puncta appeared. n = 300 cells were pooled from three independent experiments. Data are shown as mean ± SD. ***P < 0.001; two‐tailed Student's t‐tests were used.
Source data are available online for this figure.
