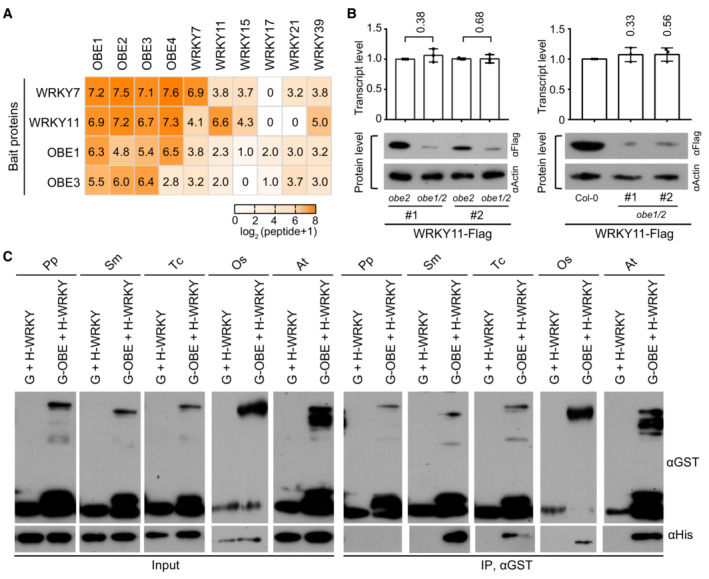
Figure 1. Determination of the interaction between group IId WRKY proteins and OBE proteins in plants.

- Heatmap showing the abundance of proteins co‐purified with Flag‐tagged WRKY7, WRKY11, OBE1, and OBE3 as determined by AP‐MS in Arabidopsis plants. The number of matched peptides was used to calculate the abundance of purified proteins. Transgenic plants expressing the indicated bait proteins were used for AP‐MS.
- Effect of obe1/2 on the protein abundance of WRKY11‐Flag in transgenic Arabidopsis plants. The transcript (top) and protein (bottom) levels of WRKY11‐Flag transgene in obe2 and obe1/2 mutants and wild‐type backgrounds are shown. The actin protein level is shown as a loading control. Values are means ± SD of three biological replicates. P‐values were determined by two‐tailed Student's t‐test.
- Determination of the interactions between WRKY11 and OBE1 orthologs from Physcomitrium patens (Pp), Selaginella moellendorffii (Sm), Taxus chinensis (Tc), Oryza sativa (Os), and Arabidopsis thaliana (At) by in vitro pull‐down assays. His‐tagged WRKY11 orthologs and GST‐tagged OBE1 orthologs were expressed and purified from bacteria and then subjected to GST pull‐down assays. G, GST; H, His.
Source data are available online for this figure.
