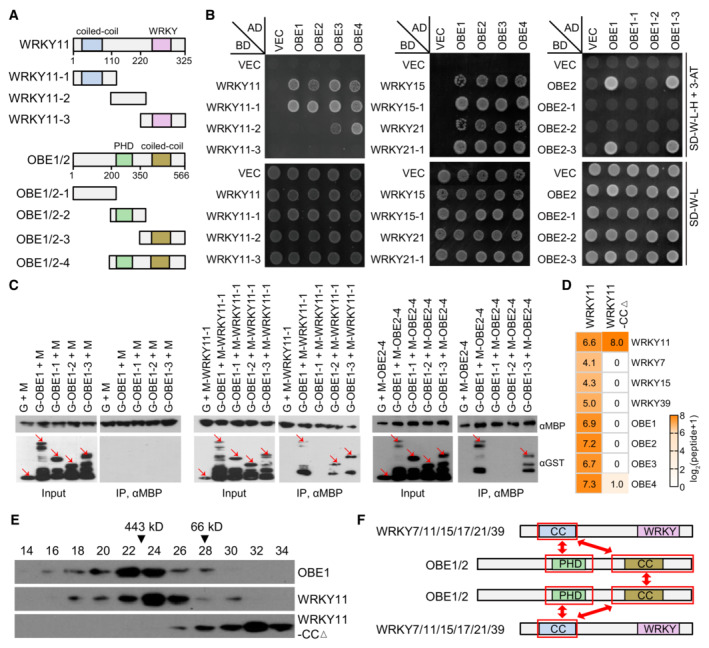
Figure 2. Characterization of the protein–protein interactions in the Arabidopsis WRKY‐OBE complex.

-
ADiagram showing full‐length and truncated versions of WRKY11 and OBE1/2 proteins used in Y2H and/or pull‐down assays. Conserved domains are shown.
-
BDetermination of the protein–protein interactions in the WRKY‐OBE complex by Y2H assays. Yeast strains expressing indicated GAL4‐AD‐ and GAL4‐BD‐fused proteins were grown on SD medium lacking Trp and Leu (SD‐W‐L) and SD medium lacking Trp, Leu, and His (SD‐W‐L‐H) supplemented with 3 mM 3‐AT. The yeast strain harboring the empty GAL4‐AD and GAL4‐BD vectors (VEC) was used as a negative control.
-
CDetermination of the protein–protein interactions in the WRKY‐OBE complex by pull‐down assays. The bacterially expressed full‐length and/or truncated versions of WRKY11, OBE1, and OBE2 fused with GST or MBP tags were subjected to MBP pull‐down assays. G, GST; M, MBP. Arrows point to the indicated proteins.
-
D, EDeletion of the CC domain from WRKY11 disrupts the WRKY‐OBE complex formation as determined by AP‐MS and gel filtration. In AP‐MS assays (D), transgenic plants expressing Flag‐tagged wild‐type WRKY11 and WRKY11‐CCΔ proteins were independently used for identifying the WRKY‐OBE complex. The abundance of purified proteins is represented by identified peptides as detected by AP‐MS. For gel filtration (E), proteins extracted from indicated Flag‐tagged transgenic plants were separated in a Superose 6 column (10/300 GL; GE Healthcare Life Sciences) and were detected by immunoblotting.
-
FDiagrams showing the interaction regions of WRKY and OBE proteins in the WRKY‐OBE complex as determined by Y2H and pull‐down assays. The interaction regions are labeled by red frames.
Source data are available online for this figure.
