
Figure 6. The coiled‐coil domain is required for target selection of WRKY11.
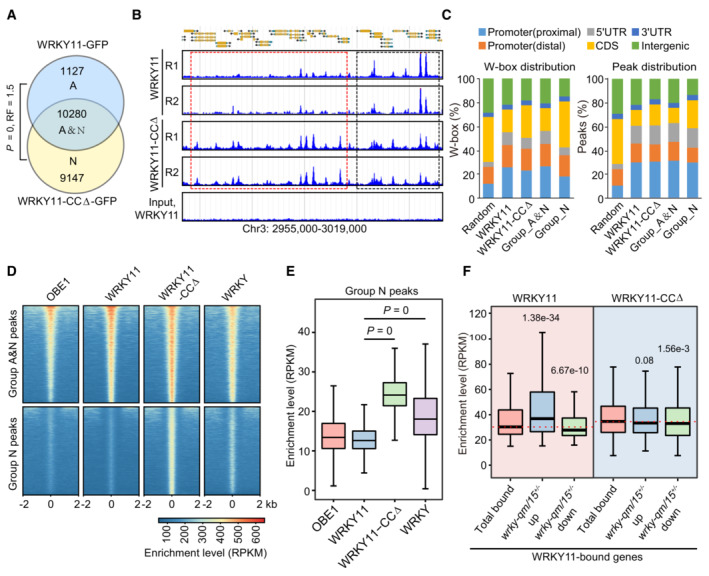
- Venn diagram showing the overlap between WRKY11 and WRKY11‐CCΔ peaks as determined by ChIP‐seq. The overlap between WRKY11 and WRKY11‐CCΔ peaks is defined as group_A&N. WRKY11‐ and WRKY11‐CCΔ‐specific peaks are defined as group_A and group_N peaks, respectively. P‐values were determined by the hypergeometric test (one‐tailed). RF (representation factor) represents the number of observed overlapping genes divided by the number of expected overlapping genes drawn from two independent groups.
- Genome browser view of the ChIP‐seq signals of WRKY11 and WRKY11‐CCΔ at randomly selected genomic regions. WRKY11 and WRKY11‐CCΔ shared peaks are labeled by black boxes, and WRKY11‐CCΔ‐specific peaks are labeled by red boxes. Two replicates of ChIP‐seq are shown.
- Distribution of the WRKY11 and WRKY11‐CCΔ W‐box distribution and peaks distribution in different genomic regions. Distal and proximal promoters represent 401–1,000 and 0–400 bp upstream of transcription start sites, respectively. The distribution of random genomic regions is shown as a control.
- Heatmaps showing the ChIP‐seq signals of WRKY11, WRKY11‐CCΔ, OBE1, and general WRKY TFs over group A&N and group N peaks. The enrichment level is indicated by RPKM as determined by ChIP‐seq.
- Box plots showing the enrichment levels of WRKY11, WRKY11‐CCΔ, OBE1, and general WRKY TFs at group N peaks (n = 9,147).
- Box plots of WRKY11‐ and WRKY11‐CCΔ‐enriched levels at total WRKY11‐bound genes and at the overlap between WRKY11‐bound genes and up‐ or downregulated genes in wrky‐qm/15 +/−. Sample size of each box plot: total WRKY11‐bound genes (n = 9,237), WRKY11‐bound genes and upregulated (n = 1,424), WRKY11‐bound genes and downregulated (n = 773).
Data information: In box plots in (E) and (F), center lines and box edges are medians and the interquartile range (IQR), respectively. Whiskers extend within 1.5 times the IQR. P‐values were determined by two‐tailed, paired Mann–Whitney U‐test in (E) and by two‐tailed, unpaired Mann–Whitney U‐test in (F) for non‐normally distributed data.
Source data are available online for this figure.