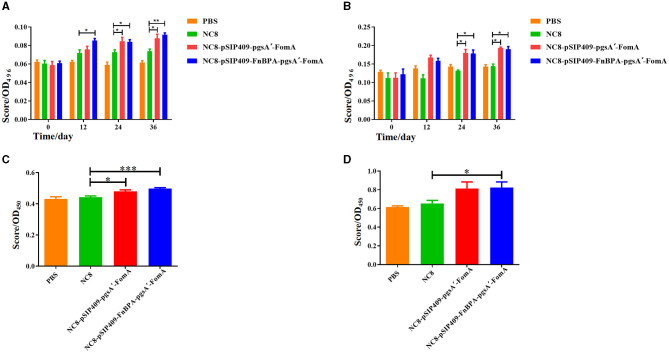
Figure 4.
Results of the ELISA experiments (A) Comparison of the increase in the fecal IgA content of the four groups of mice after each immunization. (B) The increase in the blood serum IgG content of the four groups of mice after each immunization. (C) The results of lymphocyte proliferation in the MLN. (D) The results of lymphocyte proliferation in the SP. *p < 0.05, **p < 0.01, ***p < 0.001.

