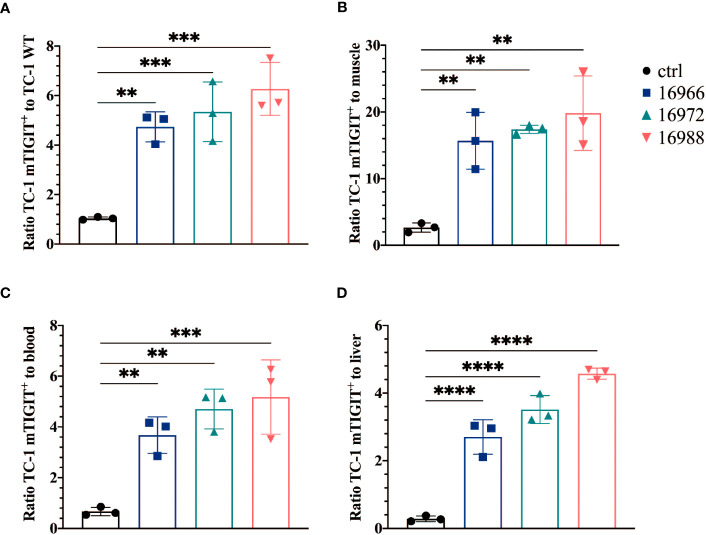
Figure 5.
Anti-mTIGIT Nbs show high signal-to-noise ratios compared to the control Nb R3B23. Ratios of uptake of 99mTc-labeled anti-mTIGIT Nbs in TC-1 mTIGIT+ tumor to (A) TC-1 WT tumor, (B) muscle, (C) blood or to (D) liver (n=3), ratios are calculated as following: uptake in TC-1 mTIGIT+ divided by uptake in TC-1 WT tumor, muscle, liver, or blood. One-way ANOVA was used to evaluate statistical significance. Statistical significance was set at p<0.05 (**=p<0.01, ***=p<0.001, ****=p<0.0001).

