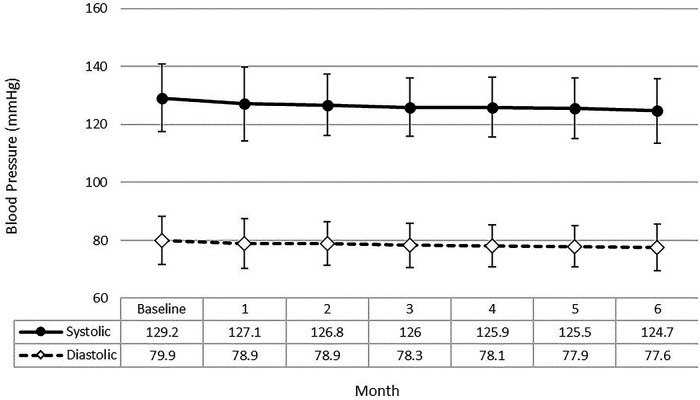
Figure 1.
Average systolic and diastolic BP for OMRON test group participants over the course of the VITAL test. The mean values for the QI project population (n = 159) appeared to decline slightly but steadily over the six-month time period examined. Error bars show the standard deviation of the mean.

