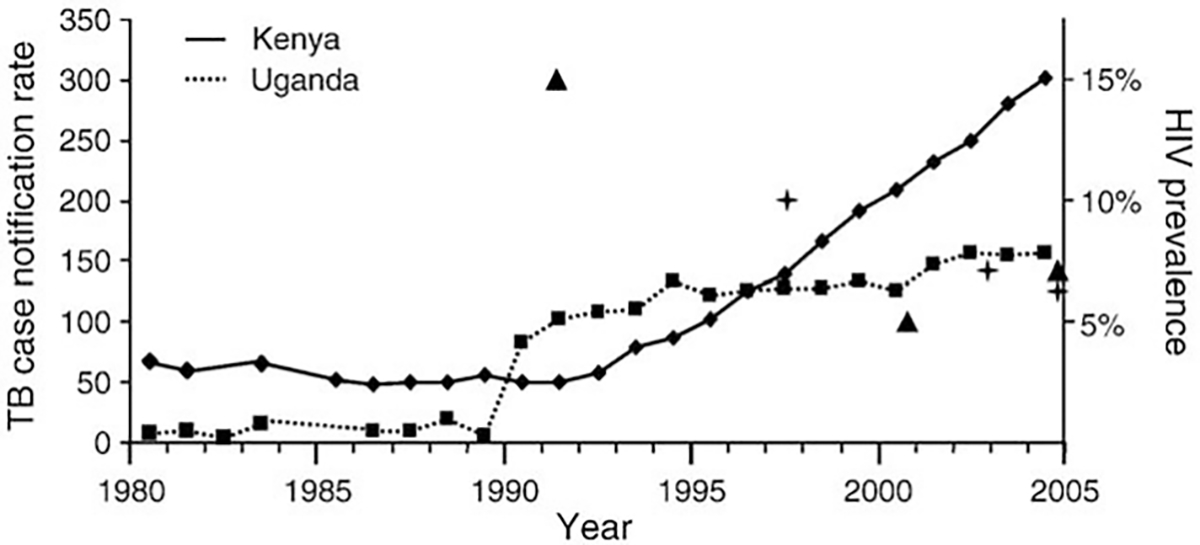
Fig. 3.

Yearly TB case notification rates per 100,000 in Kenya and Uganda for 1980–2004. Most relevant years in HIV prevalence are indicated by triangles for Uganda, and by crosses for Kenya (Uganda peaked at 15% in the early 1990s, Kenya at 10% in the late 1990s).
