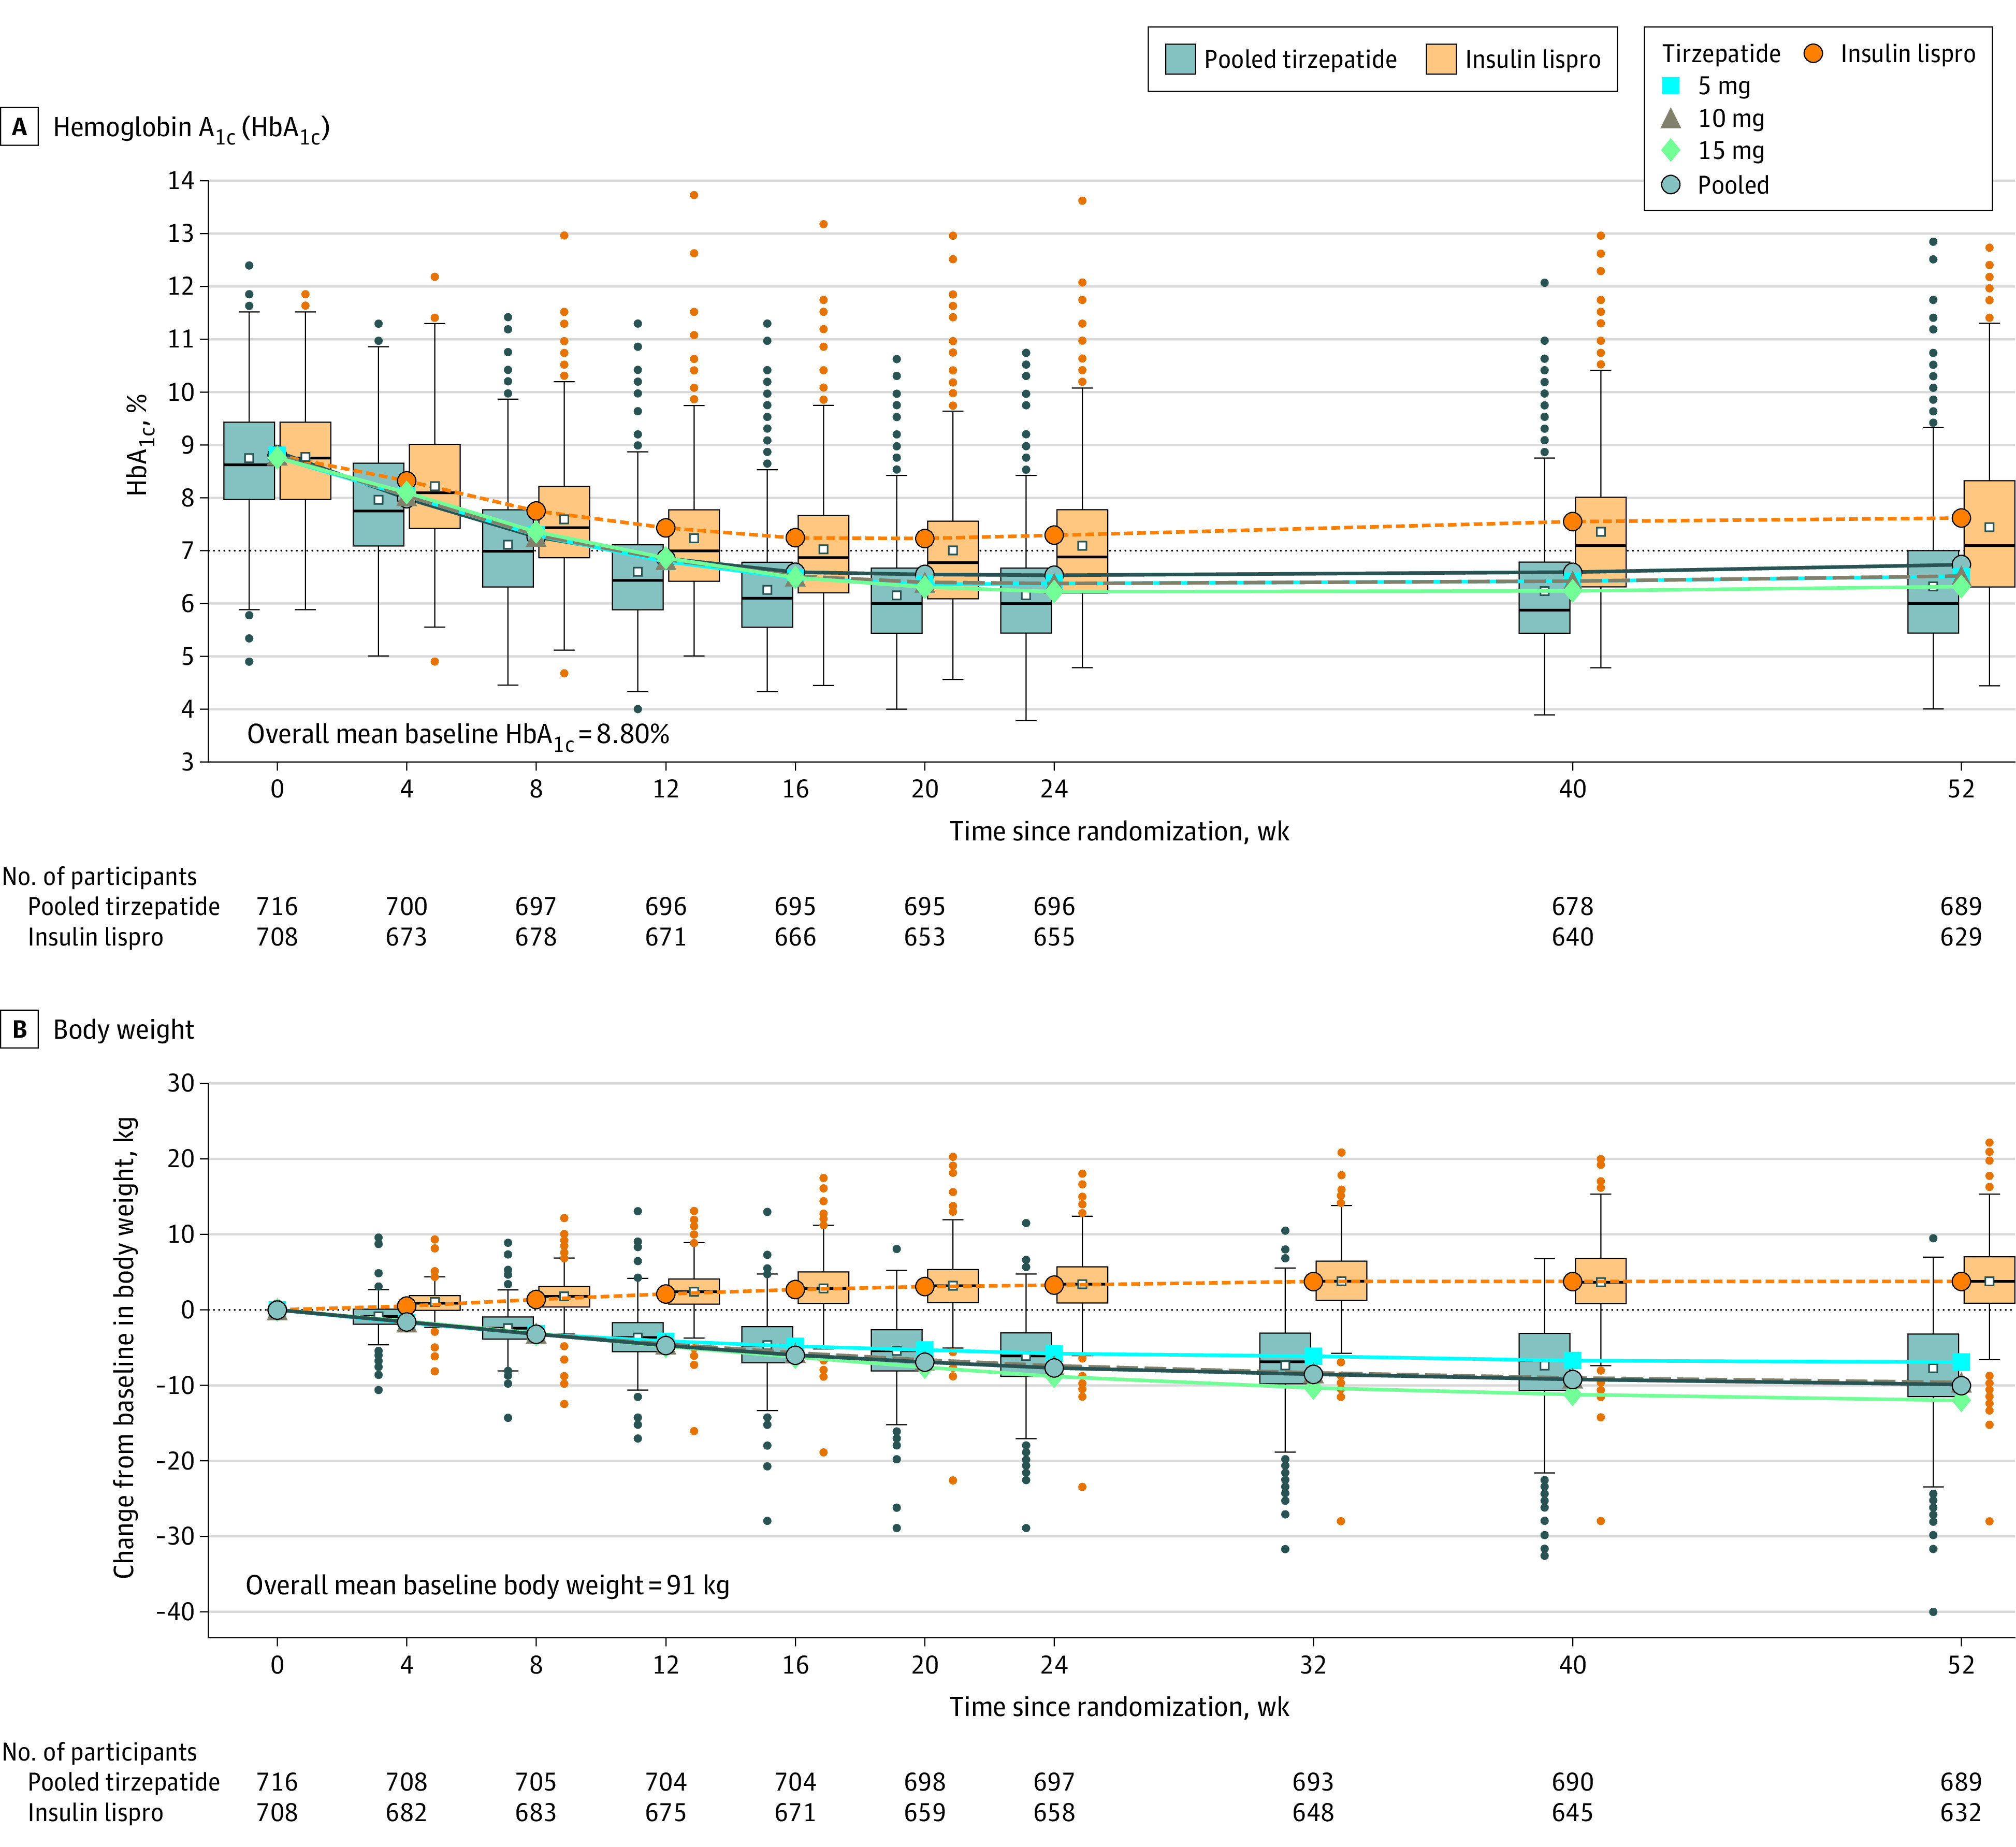
Figure 2. Effect of Tirzepatide vs Insulin Lispro on Hemoglobin A1c (HbA1c) and Body Weight.

A, Lines show the values for least-squares mean HbA1c levels over time derived from a mixed-model repeated-measures analysis (efficacy estimand). To convert HbA1c values to mmol/mol, use the equation 10.93 × HbA1c) − 23.50. Boxplots represent observed HbA1c actual values over time for randomized patients from the pooled tirzepatide and insulin lispro groups, irrespective of treatment discontinuation or initiation of rescue therapy, using the full analysis set. The middle lines within each box represent the median observed HbA1c, the symbols in the boxes represent the mean observed HbA1c, the top and bottom of the boxes represent the interquartile range, the whiskers extend to the most extreme observed values with 1.5 times the IQR of the nearer quartile, and the symbols beyond these points represent the observed values outside that range. B, Lines show least-squares mean change from baseline in body weight over time, derived from a mixed-model repeated measures analysis (efficacy estimand). Boxplots represent observed changes from baseline in body weight over time for randomized patients from the pooled tirzepatide and insulin lispro groups, irrespective of treatment discontinuation or initiation of rescue therapy, using the full analysis set. The middle lines within each box represent the median observed changes from baseline; the symbols in the boxes represent the mean observed percentage change; the box tops and bottoms represent the interquartile range; the whiskers extend to the most extreme observed values with 1.5 times the IQR of the nearer quartile; and the symbols beyond these points represent the observed values outside that range. More negative values indicate greater reductions. Due to the large y-axis scale and number of individual data points shown in panel B, some outliers are overlapping and not visualized within the boxplot.
