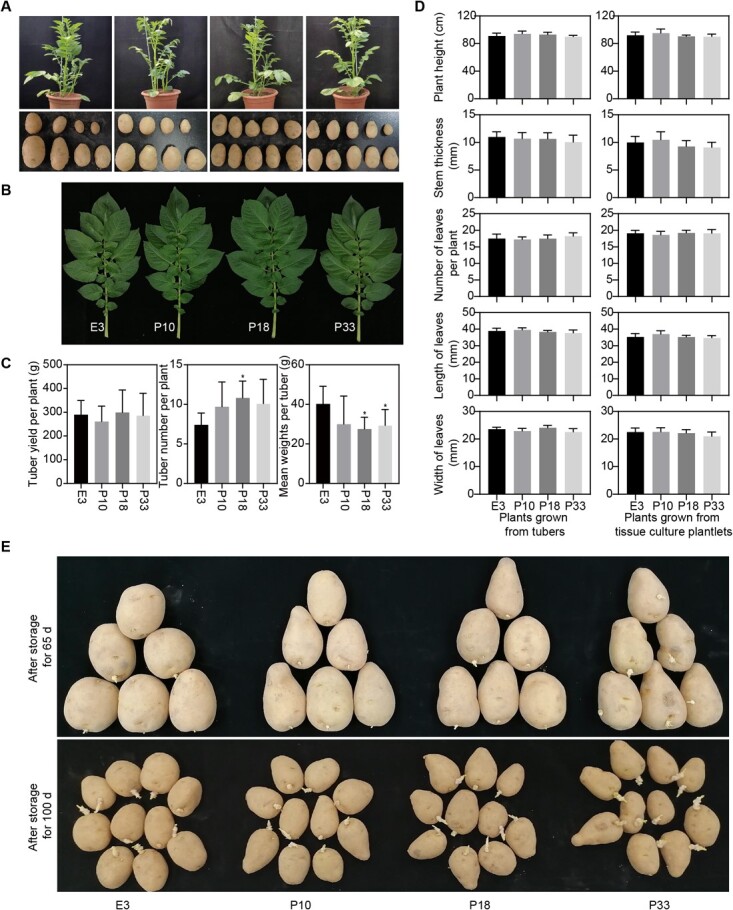
Figure 2.

Plant traits of WT E3 and three StTST1-silenced lines. (A) Pictures show potato plants (60 d after transplantation of tissue culture plantlets to greenhouses) and tuber phenotypes. (B) Tuber yield, tubers number per plant, and mean weights per tuber. The data depict the mean ± SD (n = 6). * denotes significant differences at P < 0.05 between StTST1-silenced lines and WT E3 by Dunnett's multiple comparisons tests. (C) Pictures of leaves were captured 90 days after the transplantation of tissue culture plantlets to the greenhouse. (D) Plant height, stem thickness, number of leaves per plant, length of leaves, and width of leaves were measured from flowering plants grown from tubers and tissue culture plantlets, respectively. The data depict the mean ± SD (n = 10). (E) Tubers (over 10 tubers per line) were stored in darkness at 23°C for sprouting observation, and tubers photographs were captured after 65 and 100 d of storage.
