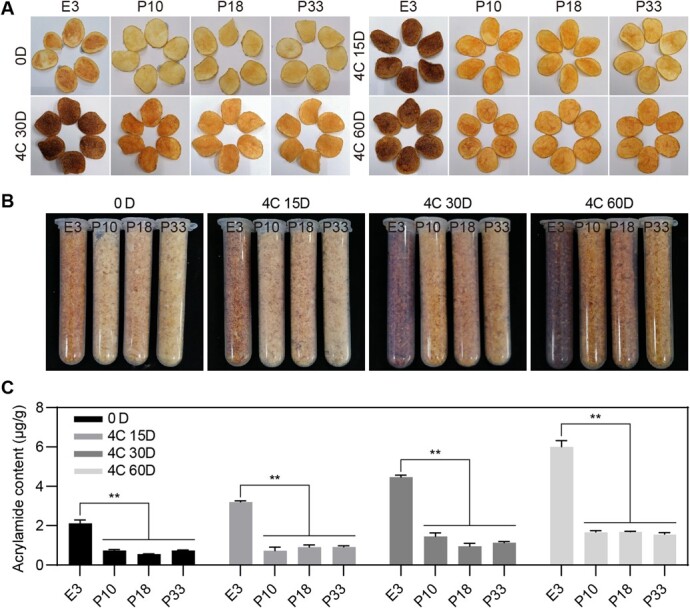
Figure 4.

Processing quality analysis of cold-stored tubers. A Potato chips produced from tubers after storage at 4°C for 0 d, 15 d, 30 d, and 60 d, respectively. B Potato chips powders of potato chips displayed in A. C Acrylamide content of corresponding potato chips shown in A. The data depict mean ± SD (n = 3). ** denotes a statistical significance at P < 0.01 between StTST1-silenced lines and WT E3 by Dunnett's multiple comparisons tests.
