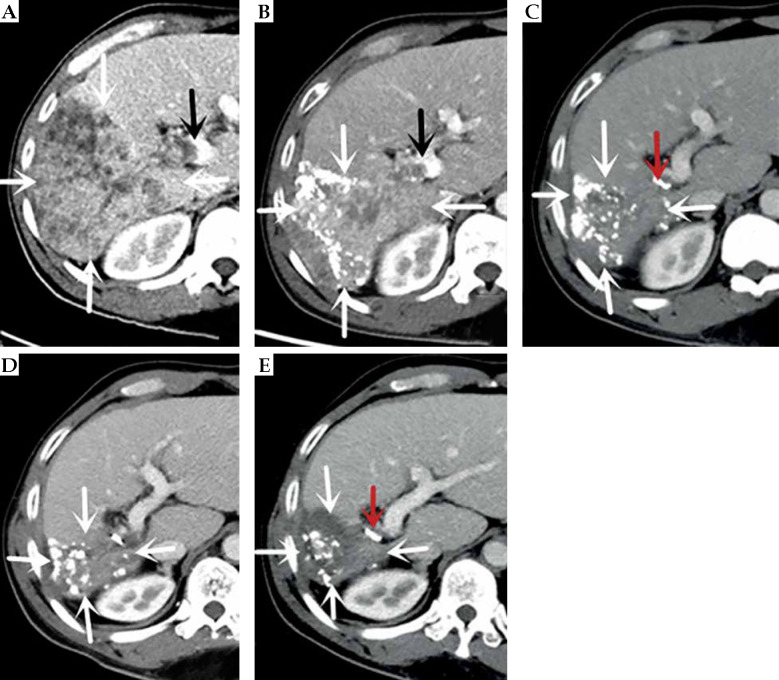
Fig. 2.
Computed tomography (CT)-enhanced cross-sectional images of the portal phase before and after treatment. A) Before treatment. B) After more than 1 month of treatment. C) After more than 8 months of treatment. D) After more than 15 months of treatment. E) After more than 23 months of treatment. The white arrow indicate the gradually shrinking liver cancer lesion, the black arrow is the portal cancer thrombus, and the red arrow is the radioactive 125I particle

