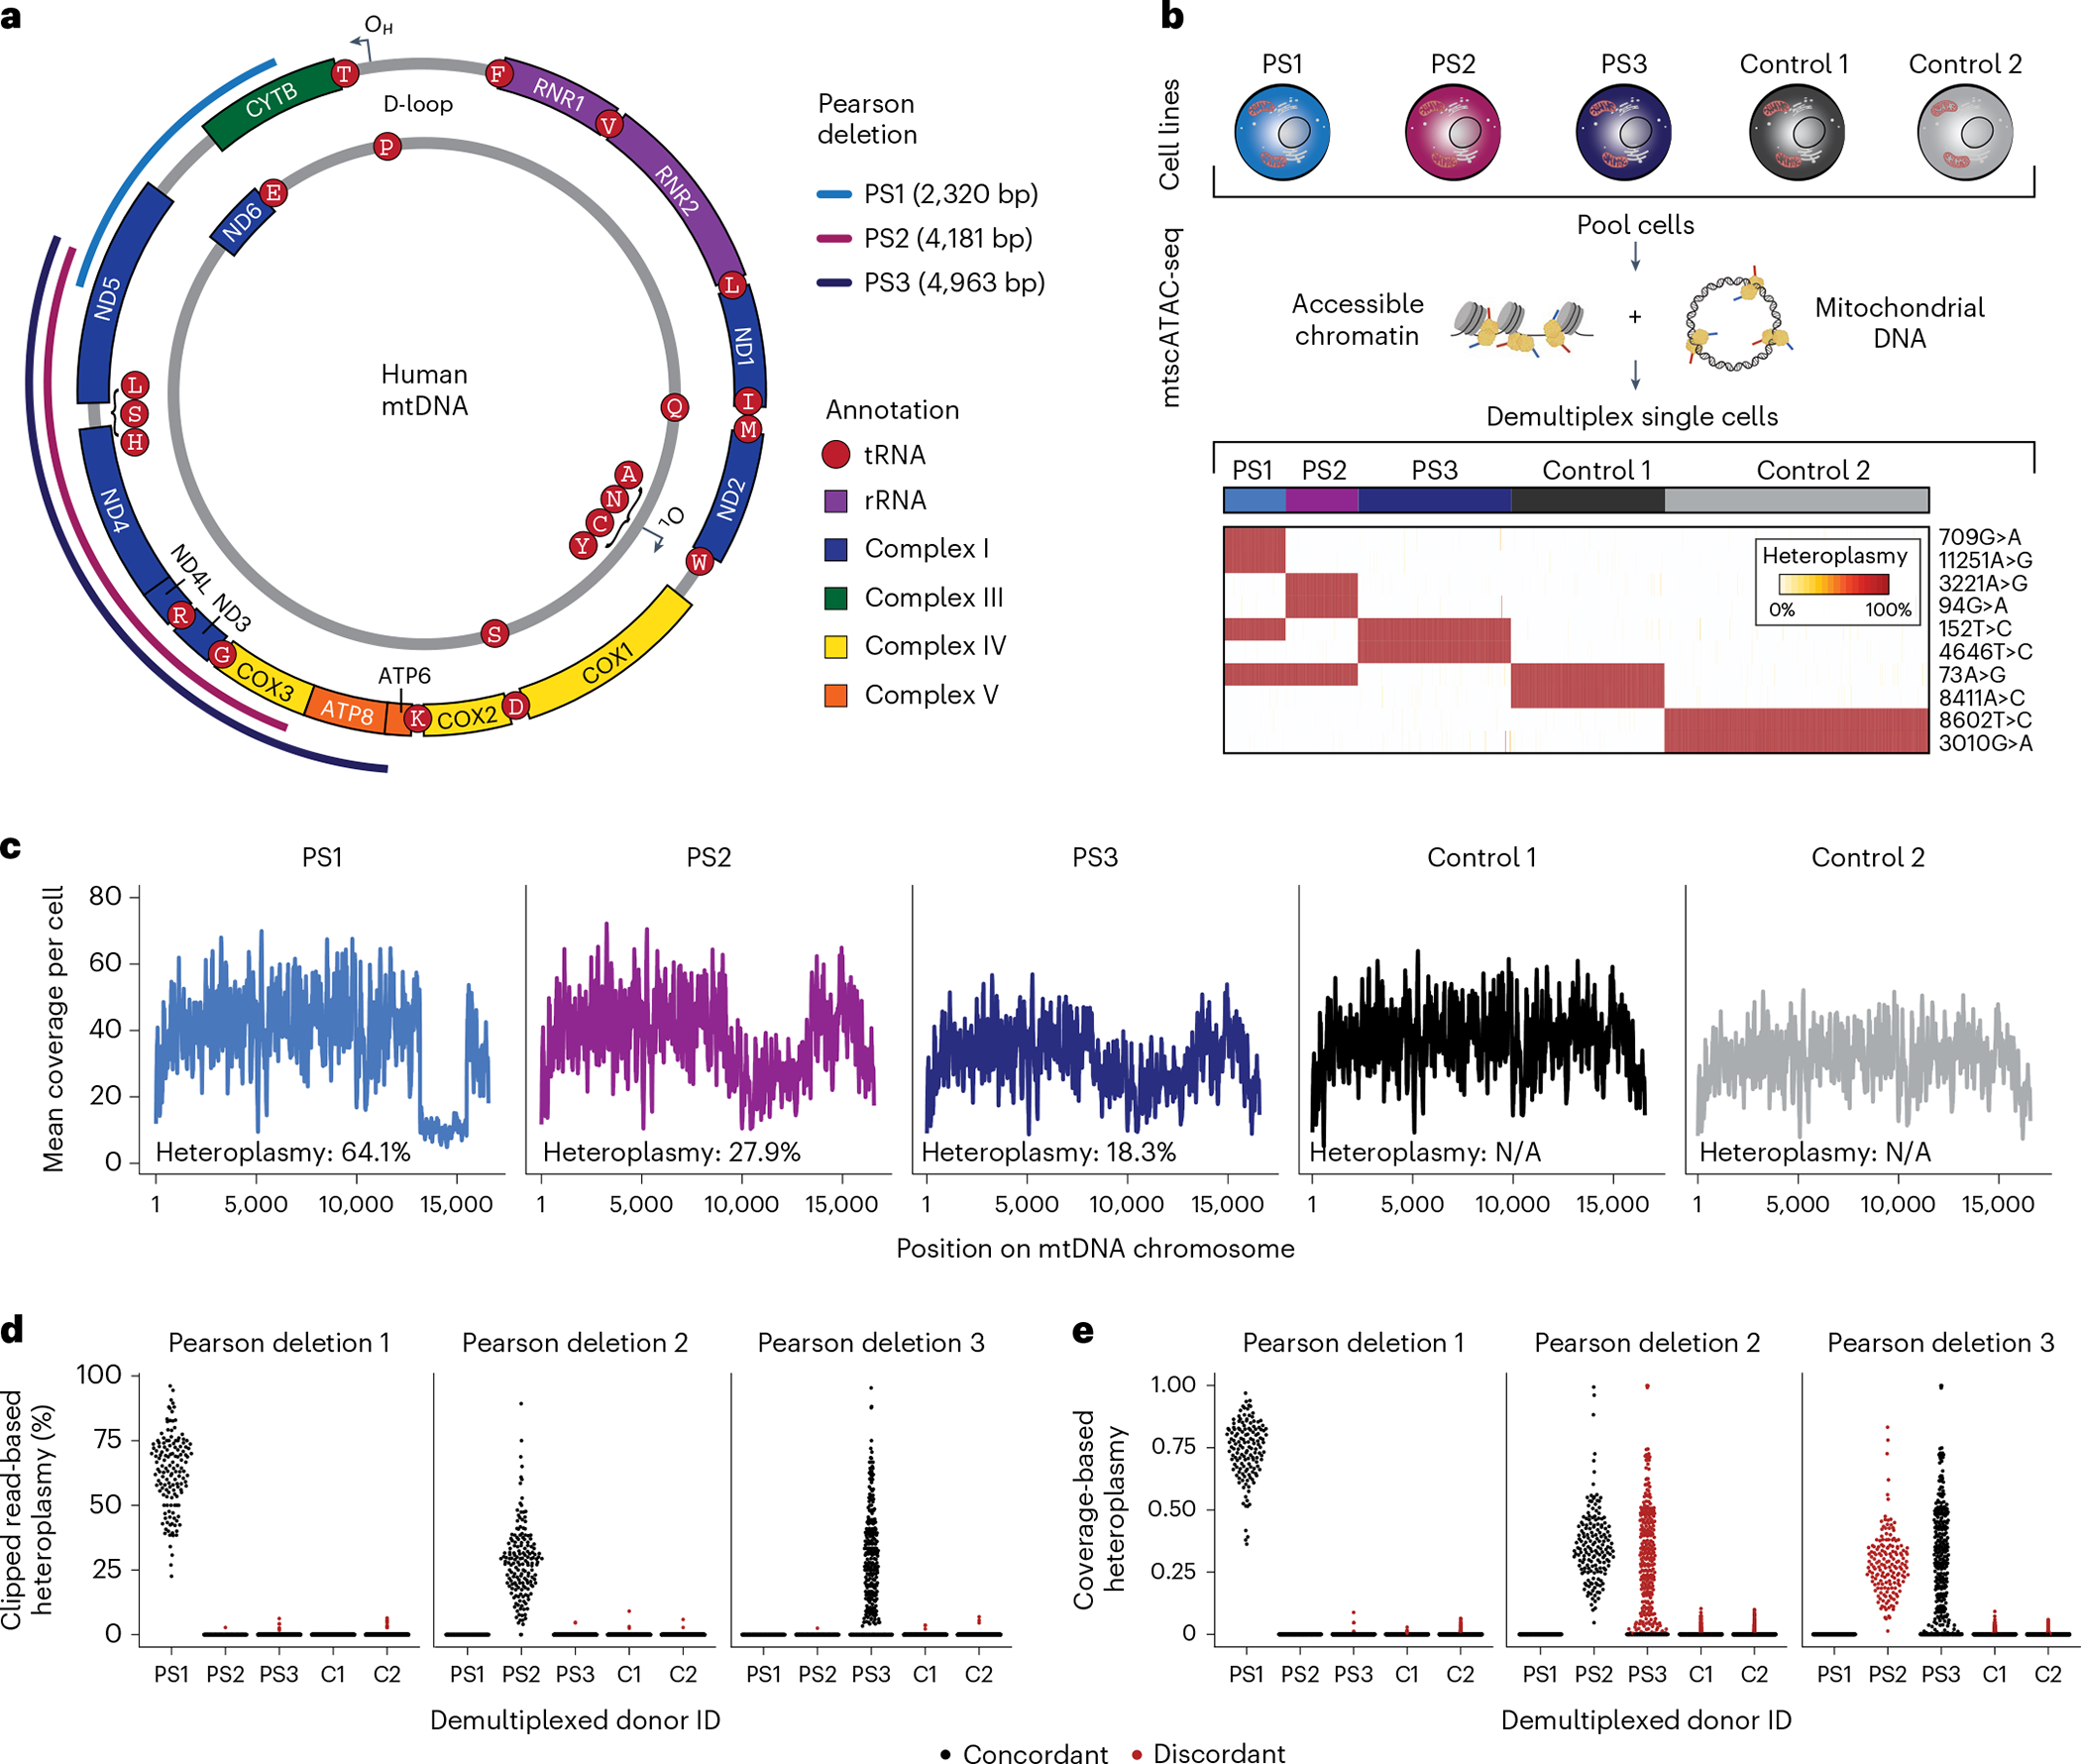
Fig. 1 |. Identification and quantification of heteroplasmic pathogenic mtDNA deletions in single cells.

a, Schematic of mtDNA in humans with PS-related deletions relevant for the cell lines examined in b. OH and OL represent the heavy and light chain origins of replication, respectively. PS1, PS2 and PS3 represent three different mtDNA deletions identified in three independent donors from which the cell lines were derived. Size and location of deletions are indicated. b, Summary of cell line mixing experiment and demultiplexing using mtDNA haplotype-derived SNVs in single cells. Heatmap depicts homoplasmic SNVs that facilitate the separation of cells from distinct donors. c, Mean coverage plots per cell across the mitochondrial genome for the demultiplexed donor cell identities. Drops in the coverage are indicative of large mtDNA deletions. d,e, Estimates of single-cell heteroplasmy using (d) clipped-read enumeration and (e) coverage-based approaches. Red dots represent false-positive heteroplasmy assessments from the deletion/donor pair (‘discordant’). Each dot represents estimated heteroplasmy from a single cell for each respective deletion. C1, C2 = Control 1 and Control 2 as in b and c.
