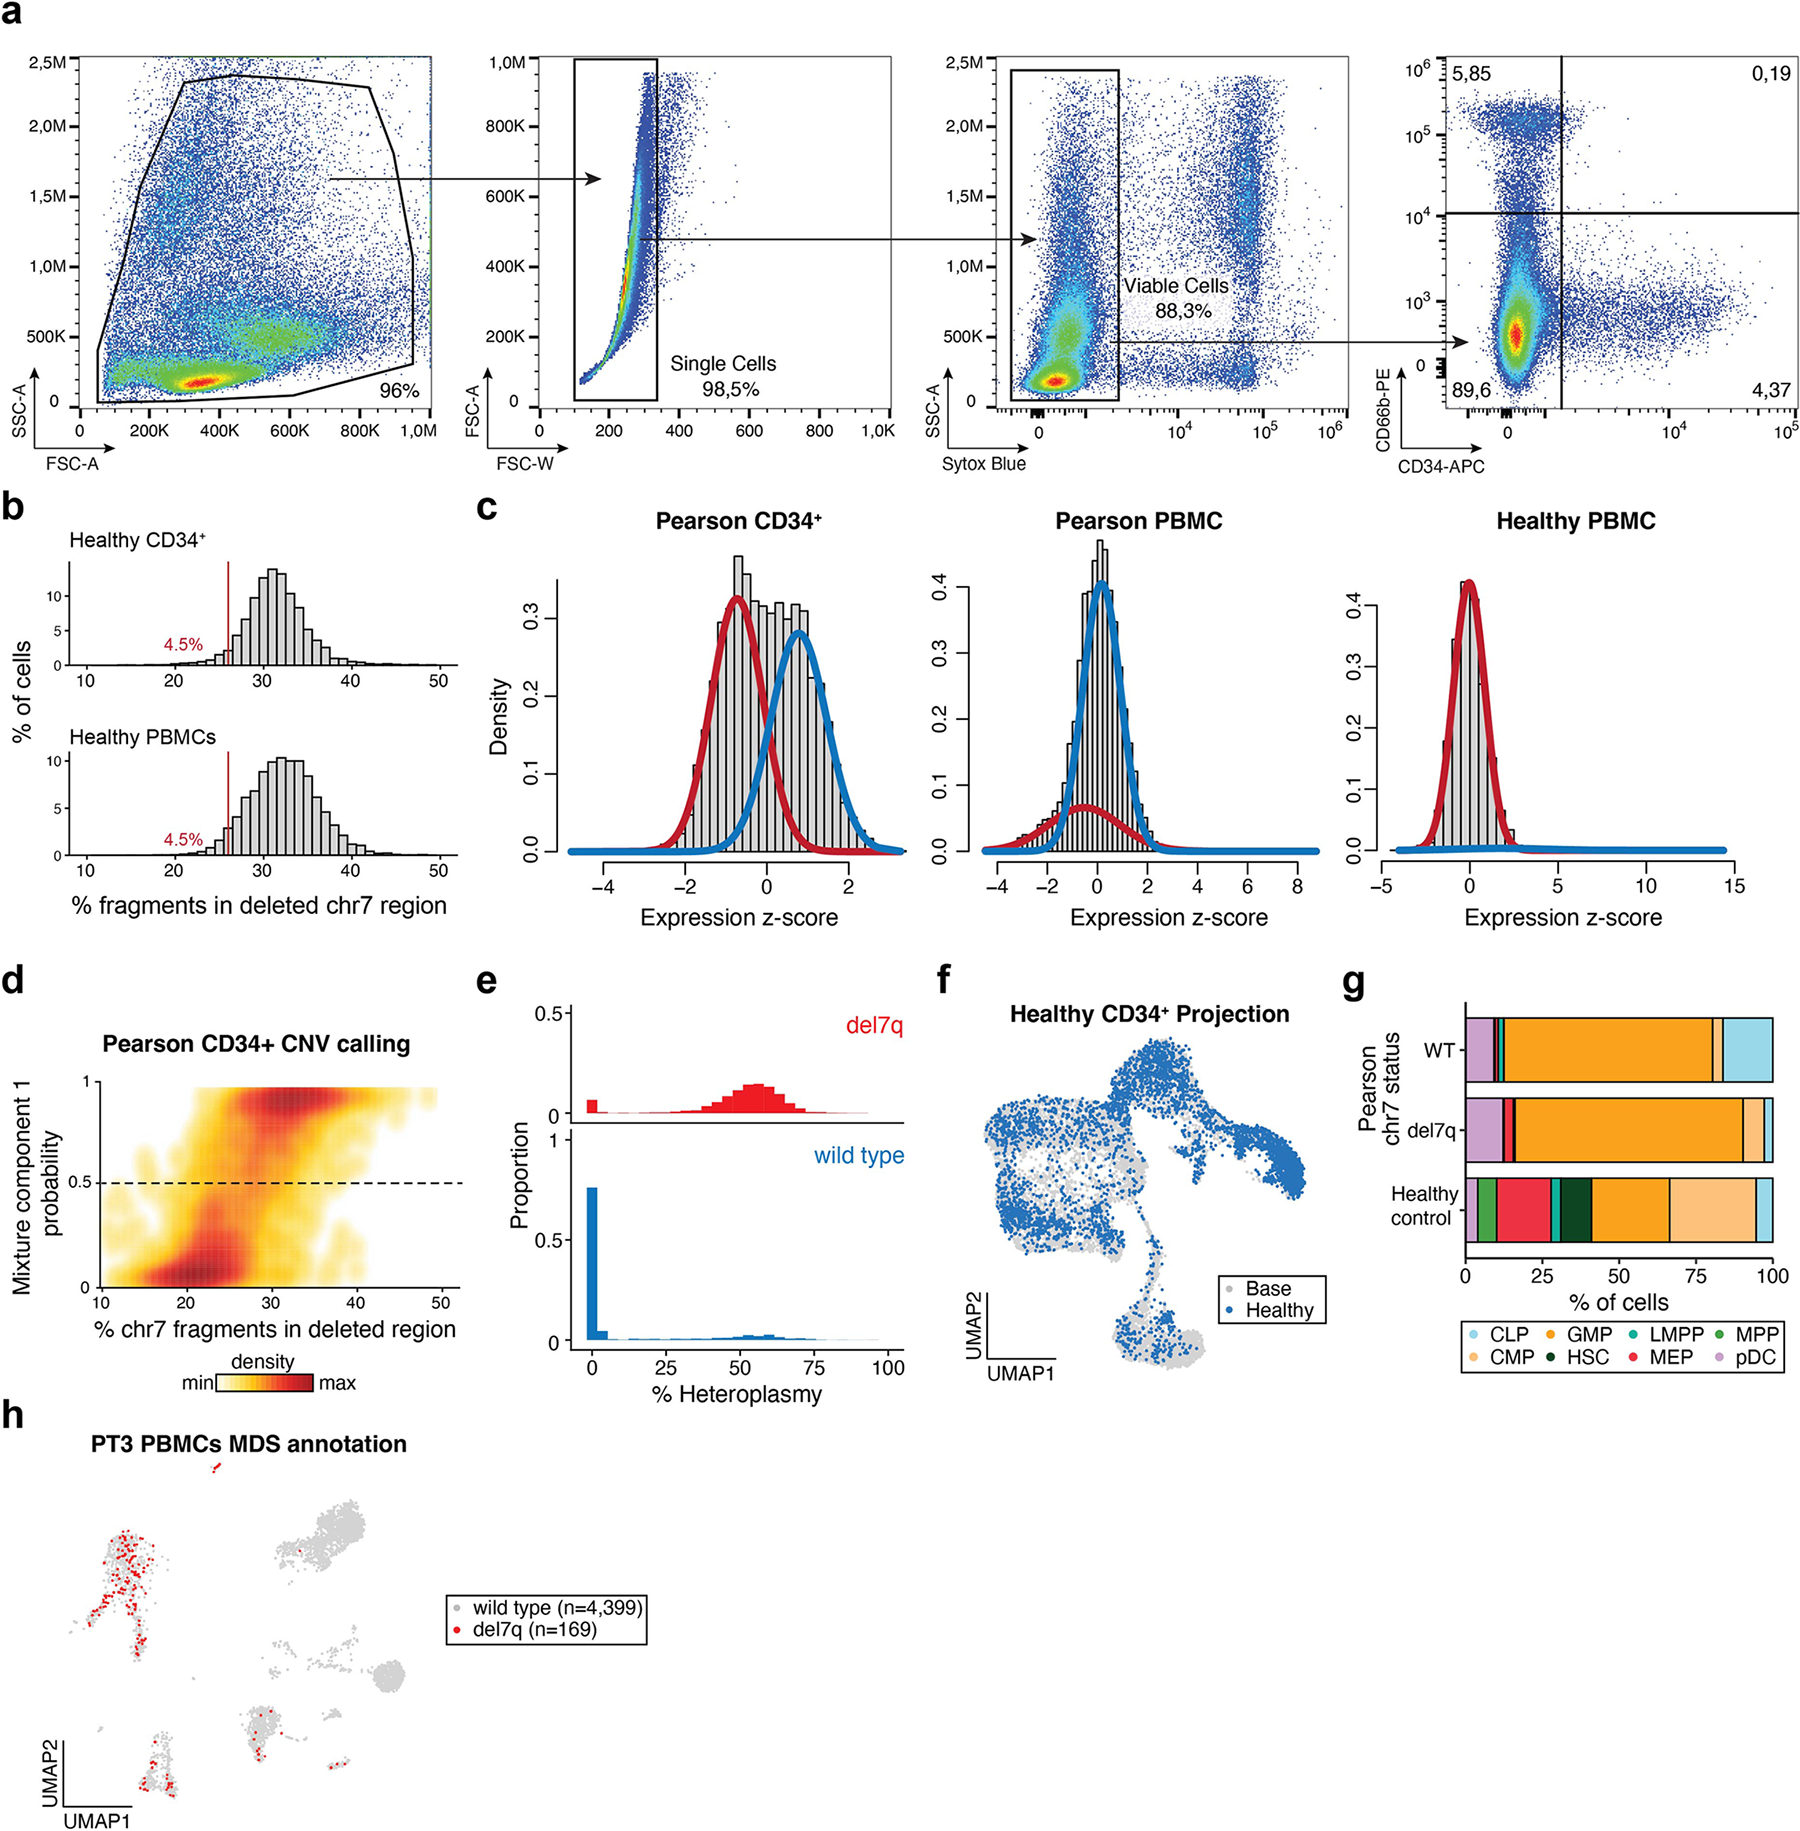
Extended Data Fig. 4 |. Supporting information for del7q calling and CD34+ mtscATAC-seq analyses.

(a) Flow cytometry gating strategy for the sorting of live CD66b−CD34+ bone marrow mononuclear cells. (b) Summary of 7q fragment abundances in healthy CD34+ and PBMC mtscATAC-seq samples9; compare to Fig. 4b with the same cutoff. (c) Result of Gaussian mixture model applied to indicated samples. The red trace indicates the first mixture component estimated (lower mean) whereas the blue trace represents the second component with a higher mean. The healthy PBMC sample does not contain a chromosome alteration. (d) Graphical density of cells from mixture model (y-axis) and from crude fragment abundance (x-axis; see Fig. 4b). The dotted line indicates the cutoff for wild type and del7q annotations. (e) Histograms of mtDNA deletion heteroplasmy proportions (%) stratified on del7q status. (f) Projection of a healthy control CD34+ mtscATAC-seq sample onto the reference embedding as shown in Fig. 5d. (g) Stacked bar plots of cell type proportions for projected cell types from PT3 with PS/MDS stratified by del7q status (MDS for positive and wild type for negative) and a healthy control donor. (h) Annotation of del7q status in PBMCs, which is primarily identified in myeloid, NK, and B-cell populations; see Fig. 2d for cluster annotations.
