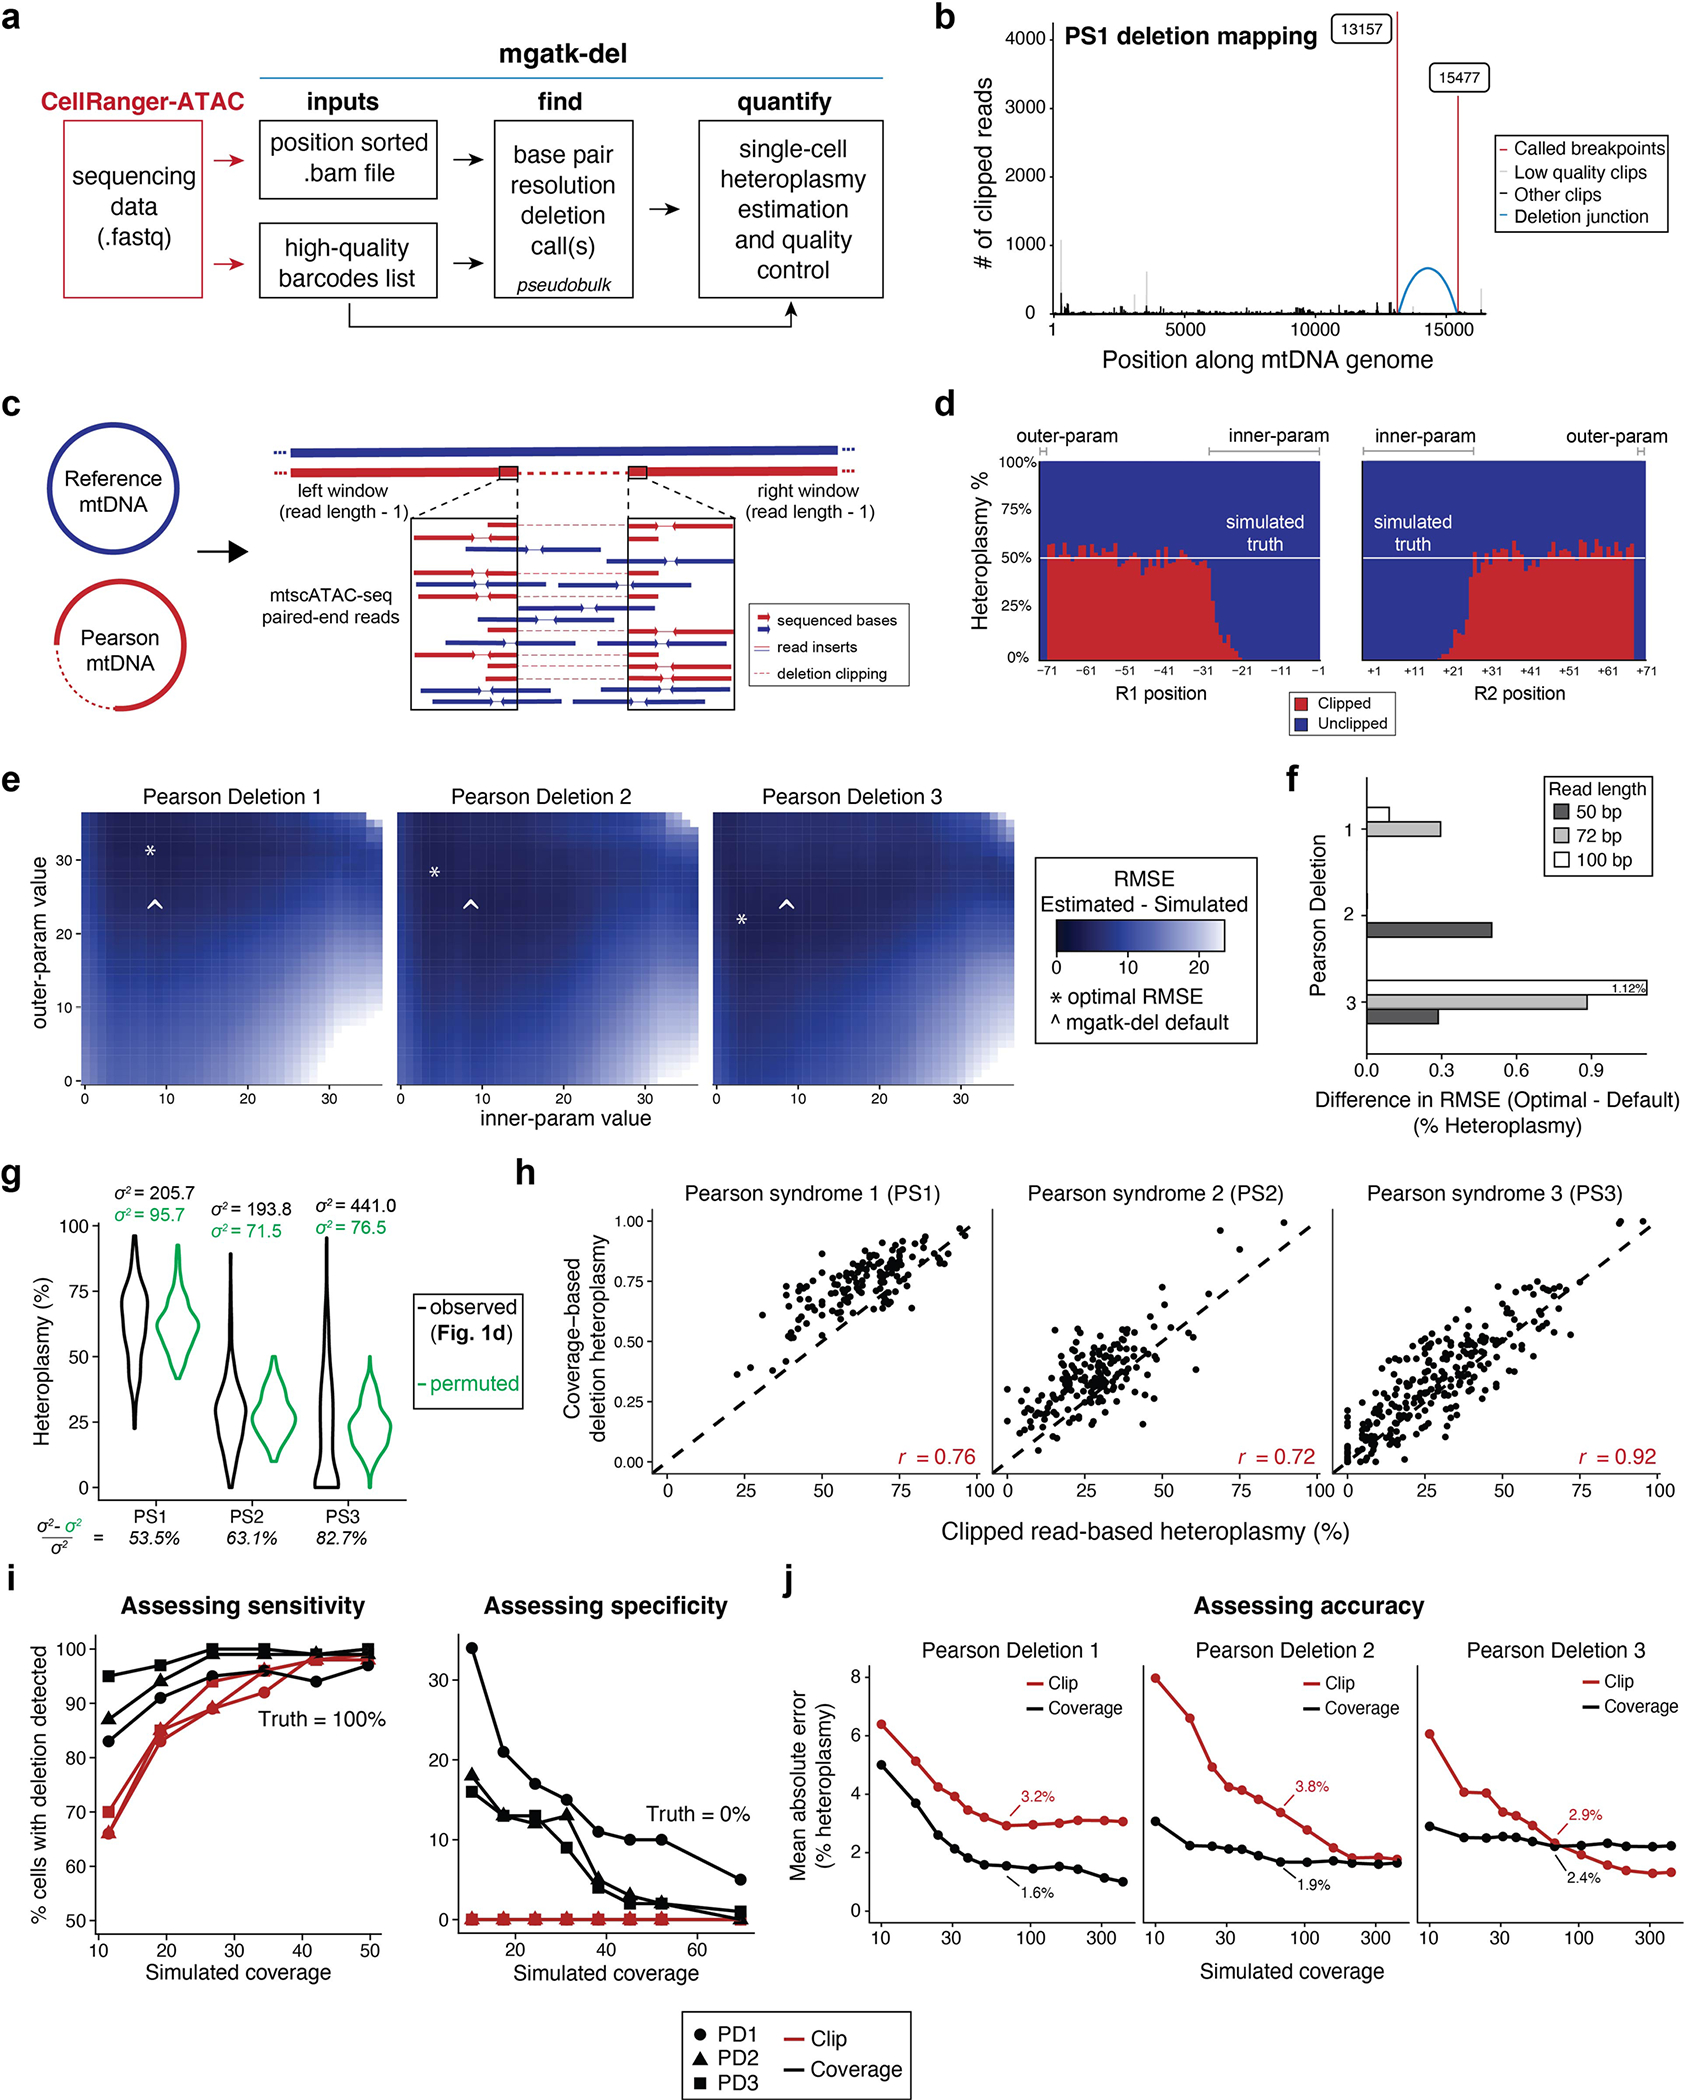
Extended Data Fig. 1 |. Deletion and heteroplasmy estimation using mgatk-del.

(a) Schematic of mgatk-del pipeline, which utilizes the outputs of CellRanger-ATAC. Two critical steps of base-resolution deletion calling (‘find’) and estimation of single-cell heteroplasmy (‘quantify’) are illustrated. (b) Output of mgatk-del ‘find’ for Pearson syndrome deletion 1 (PS1). The red vertical lines represent the called deletion breakpoints where the regions were joined (blue arc) via a secondary alignment (‘SA’ tag in.bam file). (c) Schematic of the simulation framework. Synthetic cells with known heteroplasmy were generated via mixtures of reference and PS mtDNA for all previously reported deletions. (d) Summary of results from a 50% mix showing the heteroplasmy as estimated from the ratio of clipped to unclipped reads. Parameters ‘innerparam’ and ‘outer-param’ define the number of bases that are discarded on the read when estimating the overall heteroplasmy per cell. (e) Results of exhaustive simulation for three mtDNA deletions used in the cell mixing experiment. The minimum value of the root mean squared error (RMSE) of the estimated and true heteroplasmy is noted with an asterisk over the grid search. (f) Difference in mean estimated heteroplasmy (RMSE) in optimal and default parameters across a variety of settings indicating the stability. (g) Decomposition of variance using a permuted model. Black shows the observed variance whereas green shows the spread under a permuted (null) model. The percent of the variance explained by this null model is shown. (h) Single-cell correlation of clipped (Fig. 1d) versus coverage-based (Fig. 1e) heteroplasmy estimates for valid deletions per indicated deletion/donor. The Pearson correlation for the three deletions is indicated. (i) % of cells with non-zero heteroplasmy for different deletions at different coverages using indicated methods. The left panel assesses sensitivity where the true proportion of cells with the deletion is 100%. The right panel assesses specificity where the true proportion of cells with the deletion is 0%. For both plots, detection of the deletion requires ≥1% heteroplasmy. ( j) The mean absolute error in heteroplasmy at 50x coverage is indicated by the value shown on the graph for two methods of heteroplasmy estimation, as in (i).
