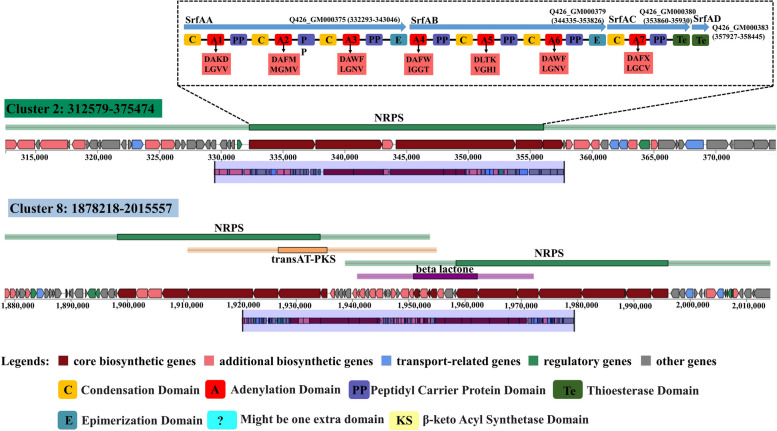
Fig. 9.
Schematic diagram of gene Clusters 2 and 8 in B. velezensis Q-426. The potential secondary metabolite biosynthetic gene clusters were predicted using antiSMASH. Genes with different functions are marked in different color blocks, which are shown in the legend. The functional domains of surfactin synthesis-related genes were analyzed using PKS/NRPS analysis. The abbreviations indicate the functions of the corresponding structural domains. The conserved binding pockets for substrates formed by amino acids in different adenylation domains are shown in light red boxes

