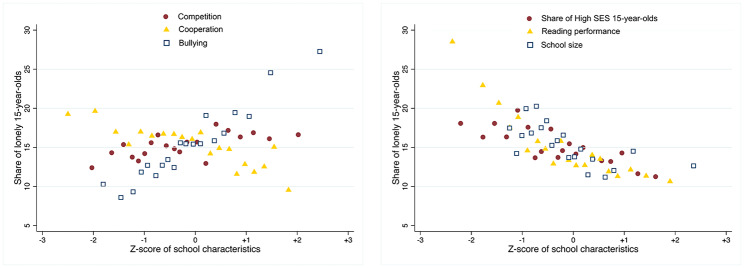
Fig. 1.
School characteristics and percent of 15-year-olds in school feeling lonely, 2018.
Source: PISA 2018, authors’ calculations. European countries included are Belgium, Bulgaria, Czechia, Germany, Denmark, Estonia, Finland, France, Greece, Croatia, Hungary, Ireland, Italy, Lithuania, Luxembourg, Latvia, Malta, Netherlands, Poland, Portugal, Romania, Slovakia and Slovenia. Note: the figures provide results of binned scatterplots, which group the x-axis variable into equally sized bins (quantiles): every data point condenses information on the average value for the x- and y-axis variables within each bin. A z-score of 0 means that the school performs at the average level of the 4 819 European schools. A higher (lower) z-scores means that the respective school characteristic has also a higher (lower) than average incidence. Binned scatterplots are obtained from standardized school level data (N = 4819), weighted using PISA school weights. School level data either refer to school-specific characteristics (school size) or to simple averages (reading performance) or shares (high-SES students, strong perceived competition, strong perceived cooperation, strong bullying experience) of students with the underlying characteristics at the school level. The standardization is done within the 23 EU countries sample used also for the rest of the analysis

