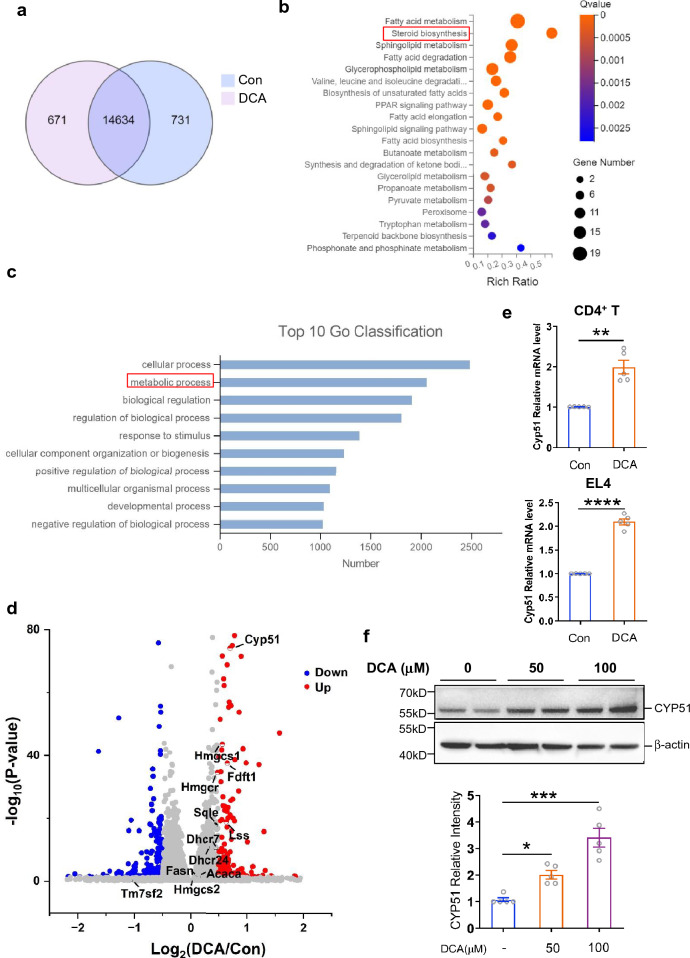
Fig. 3.
Cholesterol biosynthetic enzyme CYP51 is up-regulated upon DCA stimulation. a Venn diagram showing the overlap of genes in untreated and DCA-treated CD4+T cells (n = 3). KEGG pathways b and GO terms c enrichment analysis for DEGs (differentially expressed genes) induced by DCA. d Volcano plot of differentially expressed genes. Red and green dots respectively represent up-regulated and down-regulated DEGs upon DCA treatment. Grey dots indicate the unchanged genes. The cholesterol biosynthesis related genes were labeled. e Murine CD4+T cells or EL4 cells were treated with or without DCA (100µM) for 4h. The mRNA expression of CYP51 was determined by real-time PCR (n = 5). f EL4 cells were treated with different dosages of DCA for 24h. The protein expression level of CYP51 was determined by western blot (n = 5). *p < 0.05; **p < 0.01; ***p < 0.001; ****p < 0.0001. Two-tailed Student’s t-tests (e) or one-way ANOVA with Tukey's multiple comparisons test (f bottom panel) was used. Data are expressed as mean ± SEM from at least three independent experiments or representative data (f upper panel)

