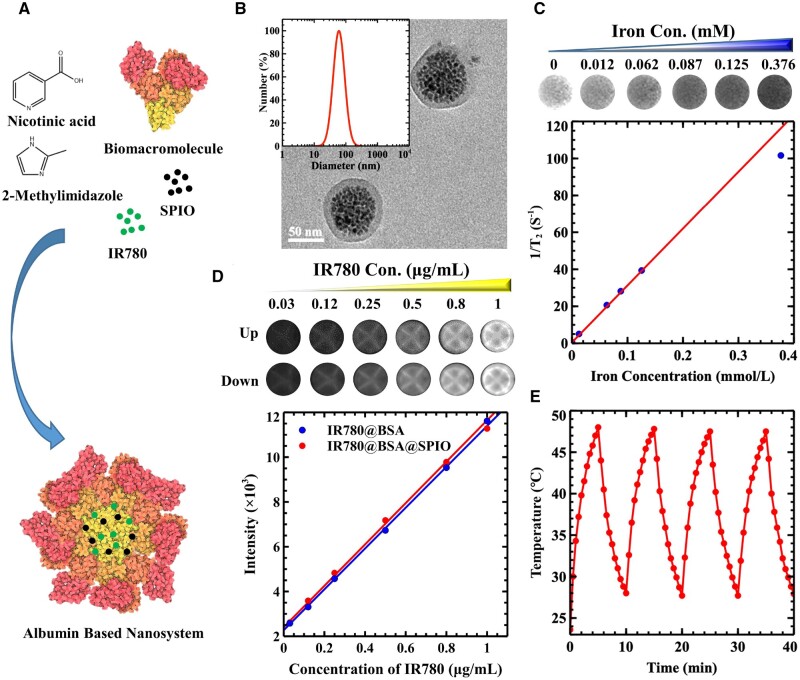
Figure 1.
(A) Synthesis diagram of IR780@BSA@SPIO nanosystem. (B) DLS data and TEM characterization of IR780@BSA@SPIO nanosystem. (C) T2WI image and the relationship between the relaxation value and concentration of IR780@BSA@SPIO nanosystem. (D) NIR-II fluorescence imaging of IR780@BSA@SPIO and IR780@BSA two systems, and the relationship between the signal intensity and IR780’s concentration. The image on the top shows the fluorescence image of IR780@BSA while the one at the bottom displays the fluorescence image of IR780@BSA@SPIO. (E) Heating absorption and dissipation rocking result of nanosystem under 808 nm laser irradiation at [IR780] 1.5 μg/mL.

