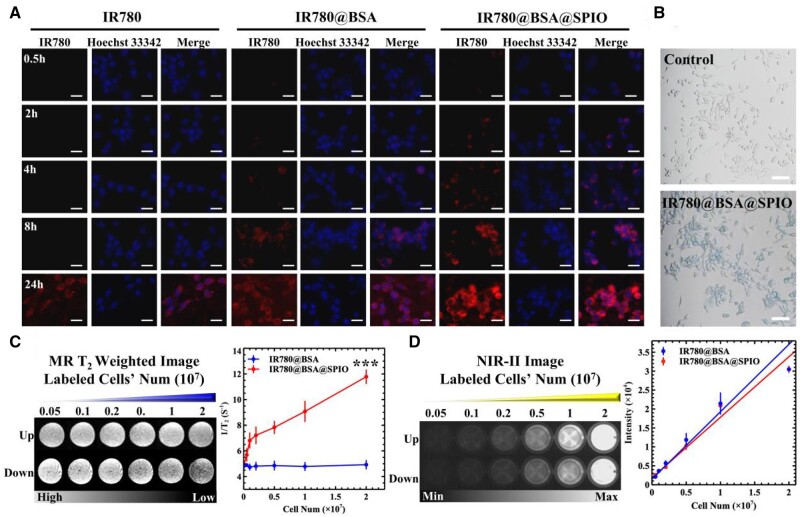
Figure 2.
(A) Fluorescent image of 4T1 cells incubated with nanomedicines for different durations. Scale bar =100 μm. (B) Prussian blue staining of the nanosystem treated cells. Scale bar =500 μm. (C) MRI-T2 imaging of these labeled cells. And the relationship between the T2-relaxation time and the cell counts. (D) The fluorescence imaging of these labeled cells. And the relation curve between signal intensity and cells’ number. The ‘up’ and ‘down’ image refer to the fluorescence image of IR780@BSA and IR780@BSA@SPIO, respectively. n = 3, ***P < 0.001.

