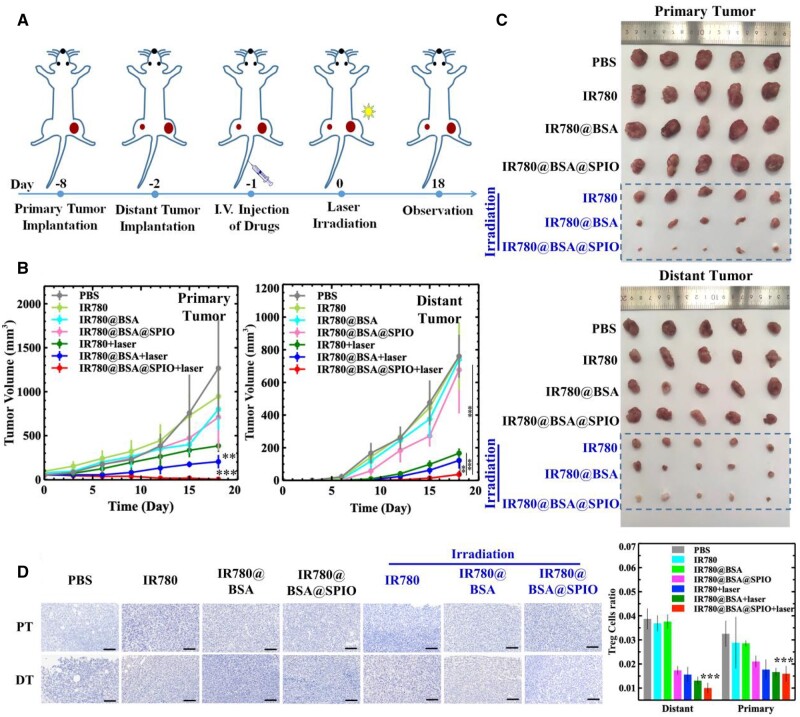
Figure 5.
(A) Schematic illustration of the in vivo experiments. (B) Primary/distant tumor volume curve of tumor-bearing mice in different treatment groups. The data are expressed as mean ± standard deviation (n = 5). (C) Images of isolated primary and distant tumor from different treatment groups. (D) Foxp3 staining and semi-quantitative analysis of primary and distant tumor sections from different treatment groups. The data are expressed as mean ± standard deviation (n = 3). Scale bar =800 μm. The variation in tumor size between the IR780@BSA@SPIO nanosystem exposed to laser irradiation and the other groups was evaluated (**P < 0.01, ***P < 0.001).

