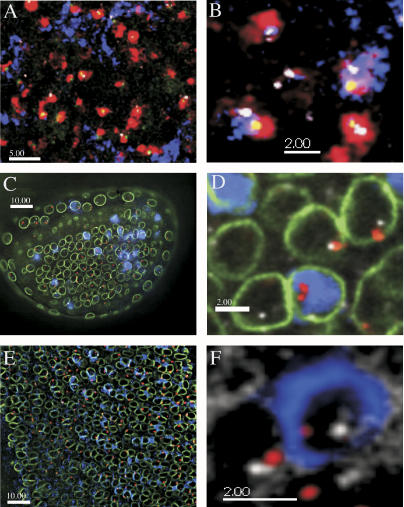
Figure 1. Gene Expression and LRCIs.
Color images show combined FISH–gene expression results for each of the three lines studied.
(A and B) bwD adult eye tissue. brown-expressing cells with pigment are blue, DAPI is red, single-copy FISH marking the brown locus is white, and heterochromatic single is green. (A) Wider view of eye. (B) Close-up view showing two expressing cells at right and lower left, and one silenced cell at the lower right.
(C and D) In(3L)BL1 eye disk tissue. Blue is anti-beta-galactosidase staining, green is anti-lamin staining, white is single copy FISH, red is heterochromatic FISH signal. (C) Wide-angle view of disk. (D) Close-up view showing silenced cells and expressing cells (blue in nucleus).
(E and F) In(1)rst3 eye disk tissue. Blue is anti-White staining, green is anti-lamin, red marks heterochromatic FISH signals, and white is single-copy FISH to the white gene. (E) Wide-angle view of disk. (F) Close-up showing expressing cell ringed by White protein and silenced cell nearby with no staining.

