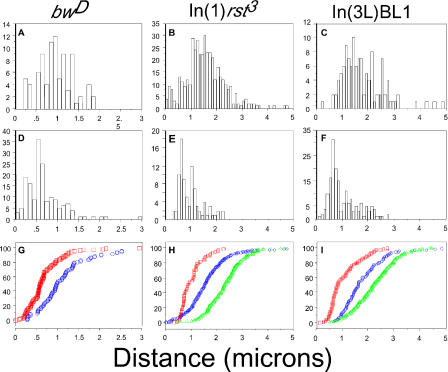
Figure 2. Silenced Genes Associate Tightly with Heterochromatin.
Physical distances in microns between heterochromatic sequences near each chromosome's centromere and the variegating gene were measured and sorted based on expressing or non-expressing cells.
(A–C) Expressing cells.
(D–F) Silenced cells.
(G–I) percentile plots of (A–F), in which blue represents expressing cells, red represents silenced cells, and green represents wild-type nuclei. bwD nuclei are Su(bwD)208 cells in adult eyes; In(1)rst3 and In(3L)BL1 data are from imaginal eye disks.

