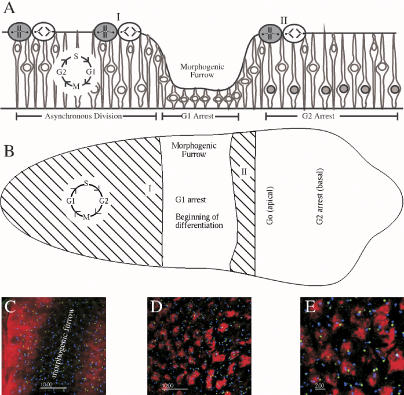
Figure 5. Identification of Cell Cycle Stages in Drosophila Eye Disks.
A combination of immunofluorescence to cyclins and tissue architecture was used to identify cells in specific cell cycle states.
(A) Cartoon of eye disk that shows populations of dividing and cell-cycle-arrested cells. I, first mitotic wave; II, second mitotic wave. G2-arrested cells are filled nuclei located basally posterior to the furrow.
(B) Cartoon of same disk viewed from above apical side of disk. Anterior is to the left.
(C–E) Immunofluorescence against G2 cyclins identifies cells in G1 and G2 arrest. Red is anti–cyclin A, green is single-copy FISH signal, and blue is heterochromatic FISH signal. (C) G1-arrested cells can be identified as those near and in the morphogenic furrow that do not show G2 cyclin staining. (D) G2-arrested cells posterior to the morphogenic furrow show dense anti–cyclin A staining. (E) Close-up of cells shown in (D).

