FIG. 2:

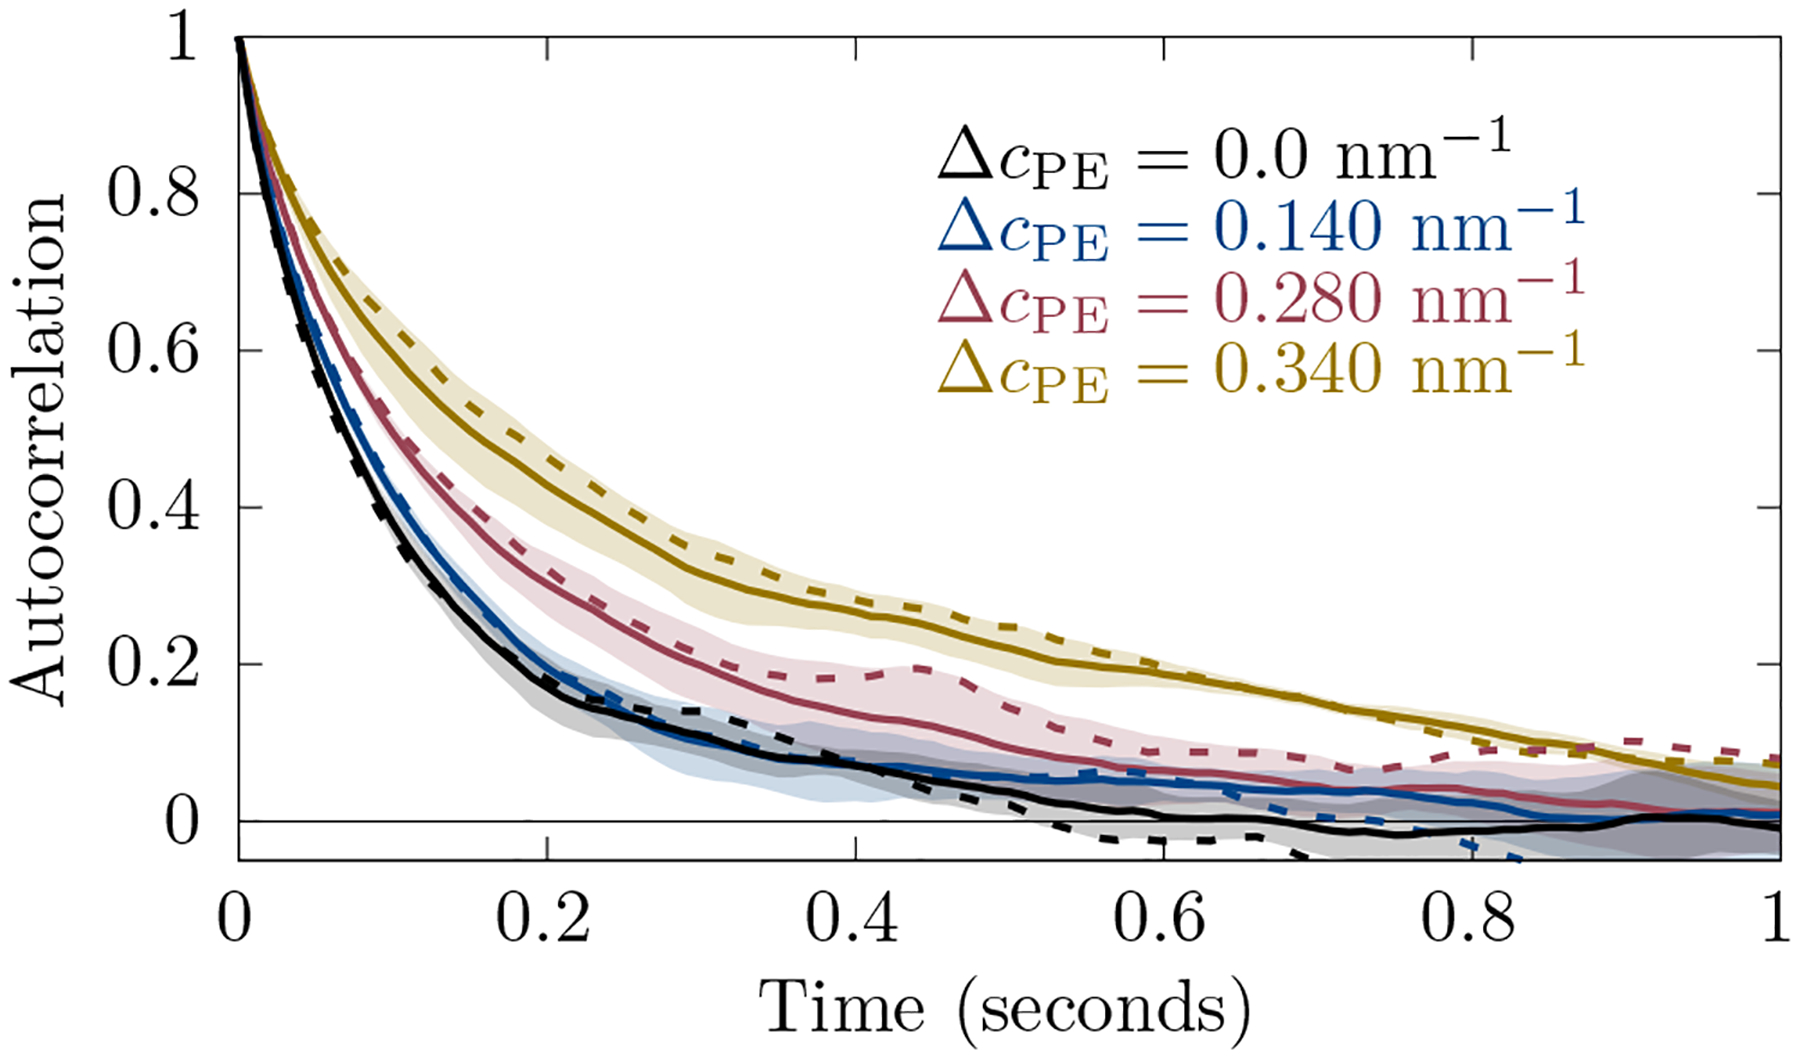
An example of autocorrelation functions from simulation (for ). Solid lines are averaged over three runs and dashed lines are for a single run. The shaded region is the standard deviation of the average. Here and .

An example of autocorrelation functions from simulation (for ). Solid lines are averaged over three runs and dashed lines are for a single run. The shaded region is the standard deviation of the average. Here and .