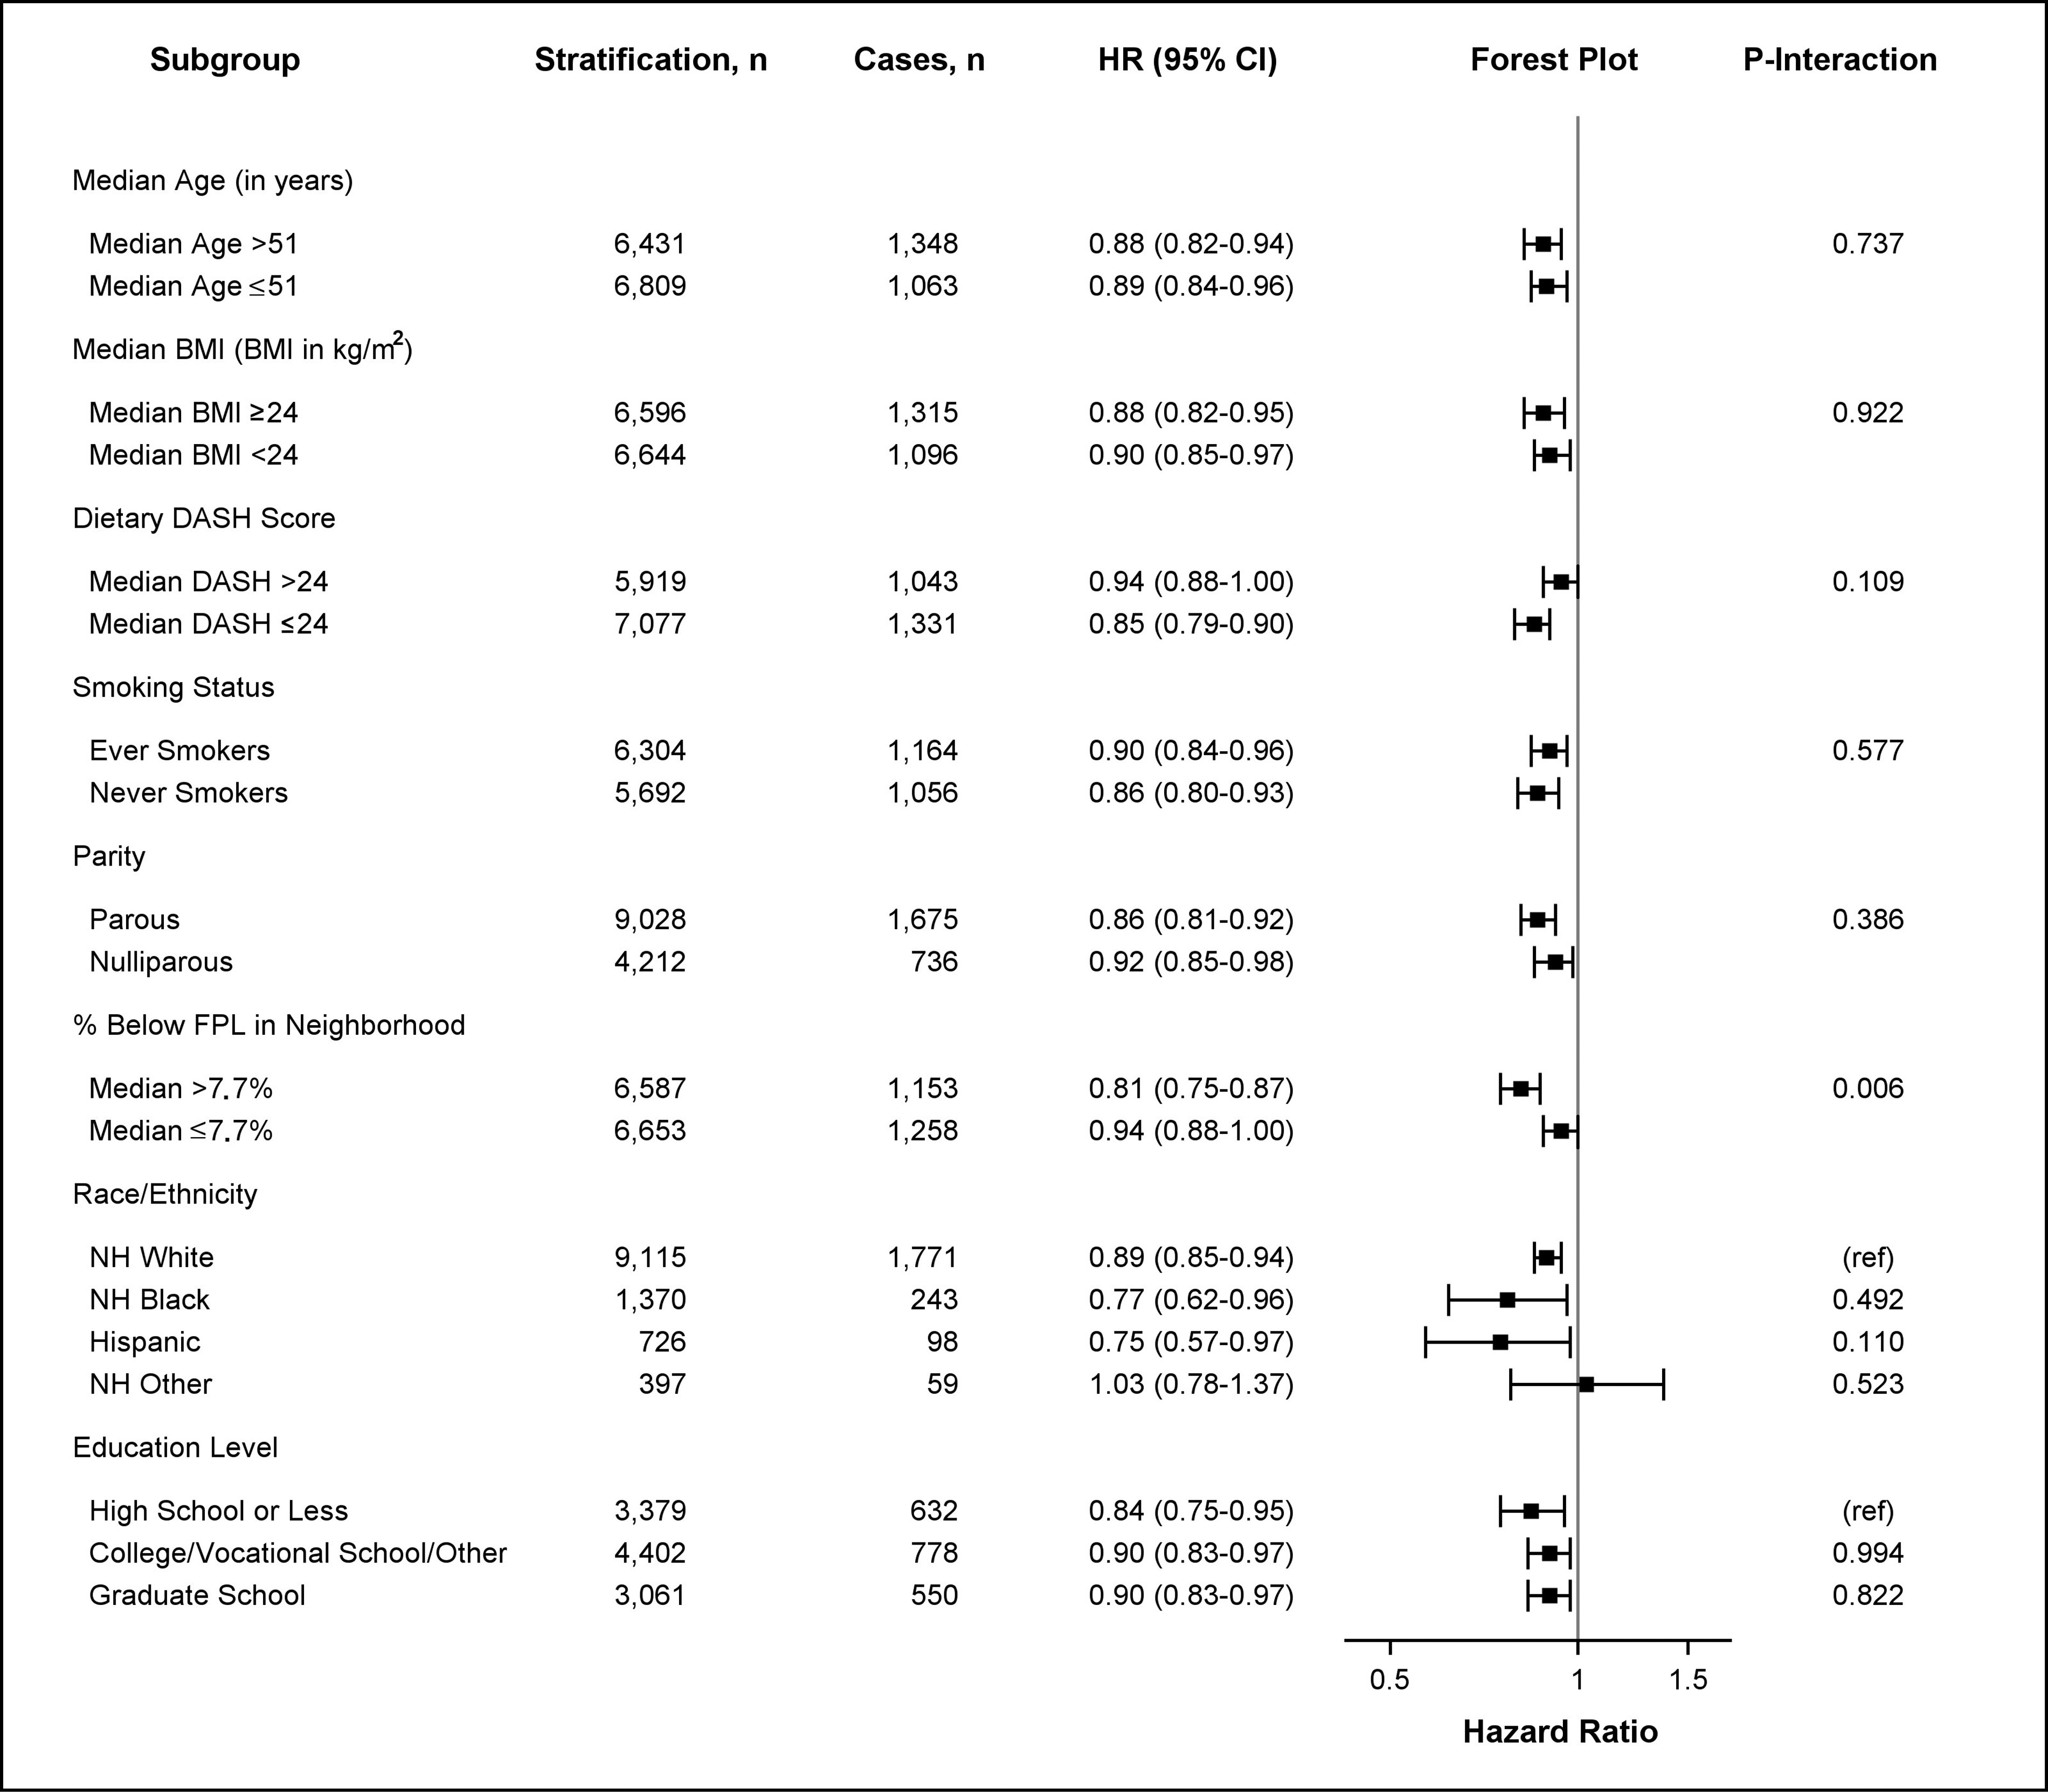
Figure 1.

HRs for obesity-related cancer risk based on neighborhood walkability by age, BMI, DASH score, smoking status, parity, poverty level, education level, and race/ethnicity. HRs and 95% CIs are shown for stratified survival models assessing the association between continuous neighborhood walkability (SD-scaled, ) and obesity-related cancer risk by potential effect modifiers. Models were adjusted for all covariates (age, race/ethnicity, education level, smoking status, alcohol intake, menopausal status, parity, percentage below the poverty level living in neighborhood at baseline, and ever moving from baseline residence at any time during follow-up) except for the stratifying variable. Age was adjusted as a continuous variable in all models (including models stratified by median age). The -axis in the forest plot shows the untransformed HRs on the log-scale. HR estimates are represented by the squares, bars represent the 95% CIs of the estimates, and the whiskers represent the lower and upper confidence limits. Obesity-related cancers include breast cancer diagnosed after menopause, colorectal (colon and rectal), pancreatic, endometrial (including uterine), ovarian, renal, thyroid, liver, gallbladder, and esophageal cancers, as well as meningioma, and multiple myeloma. represents the -value of the coefficient for the cross-product of continuous neighborhood walkability and the effect modifier. Interaction models were computed treating effect modifiers as dichotomized variables. All interactions had 13,240 observations except for analyses including dietary DASH score (), smoking status (), education level (), and race/ethnicity (), which were restricted to nonmissing values. Note: %, percentage; BMI, body mass index; CI, confidence interval; DASH, Dietary Approaches to Stop Hypertension; FPL, federal poverty level; HR, hazard ratio; NH, non-Hispanic.
