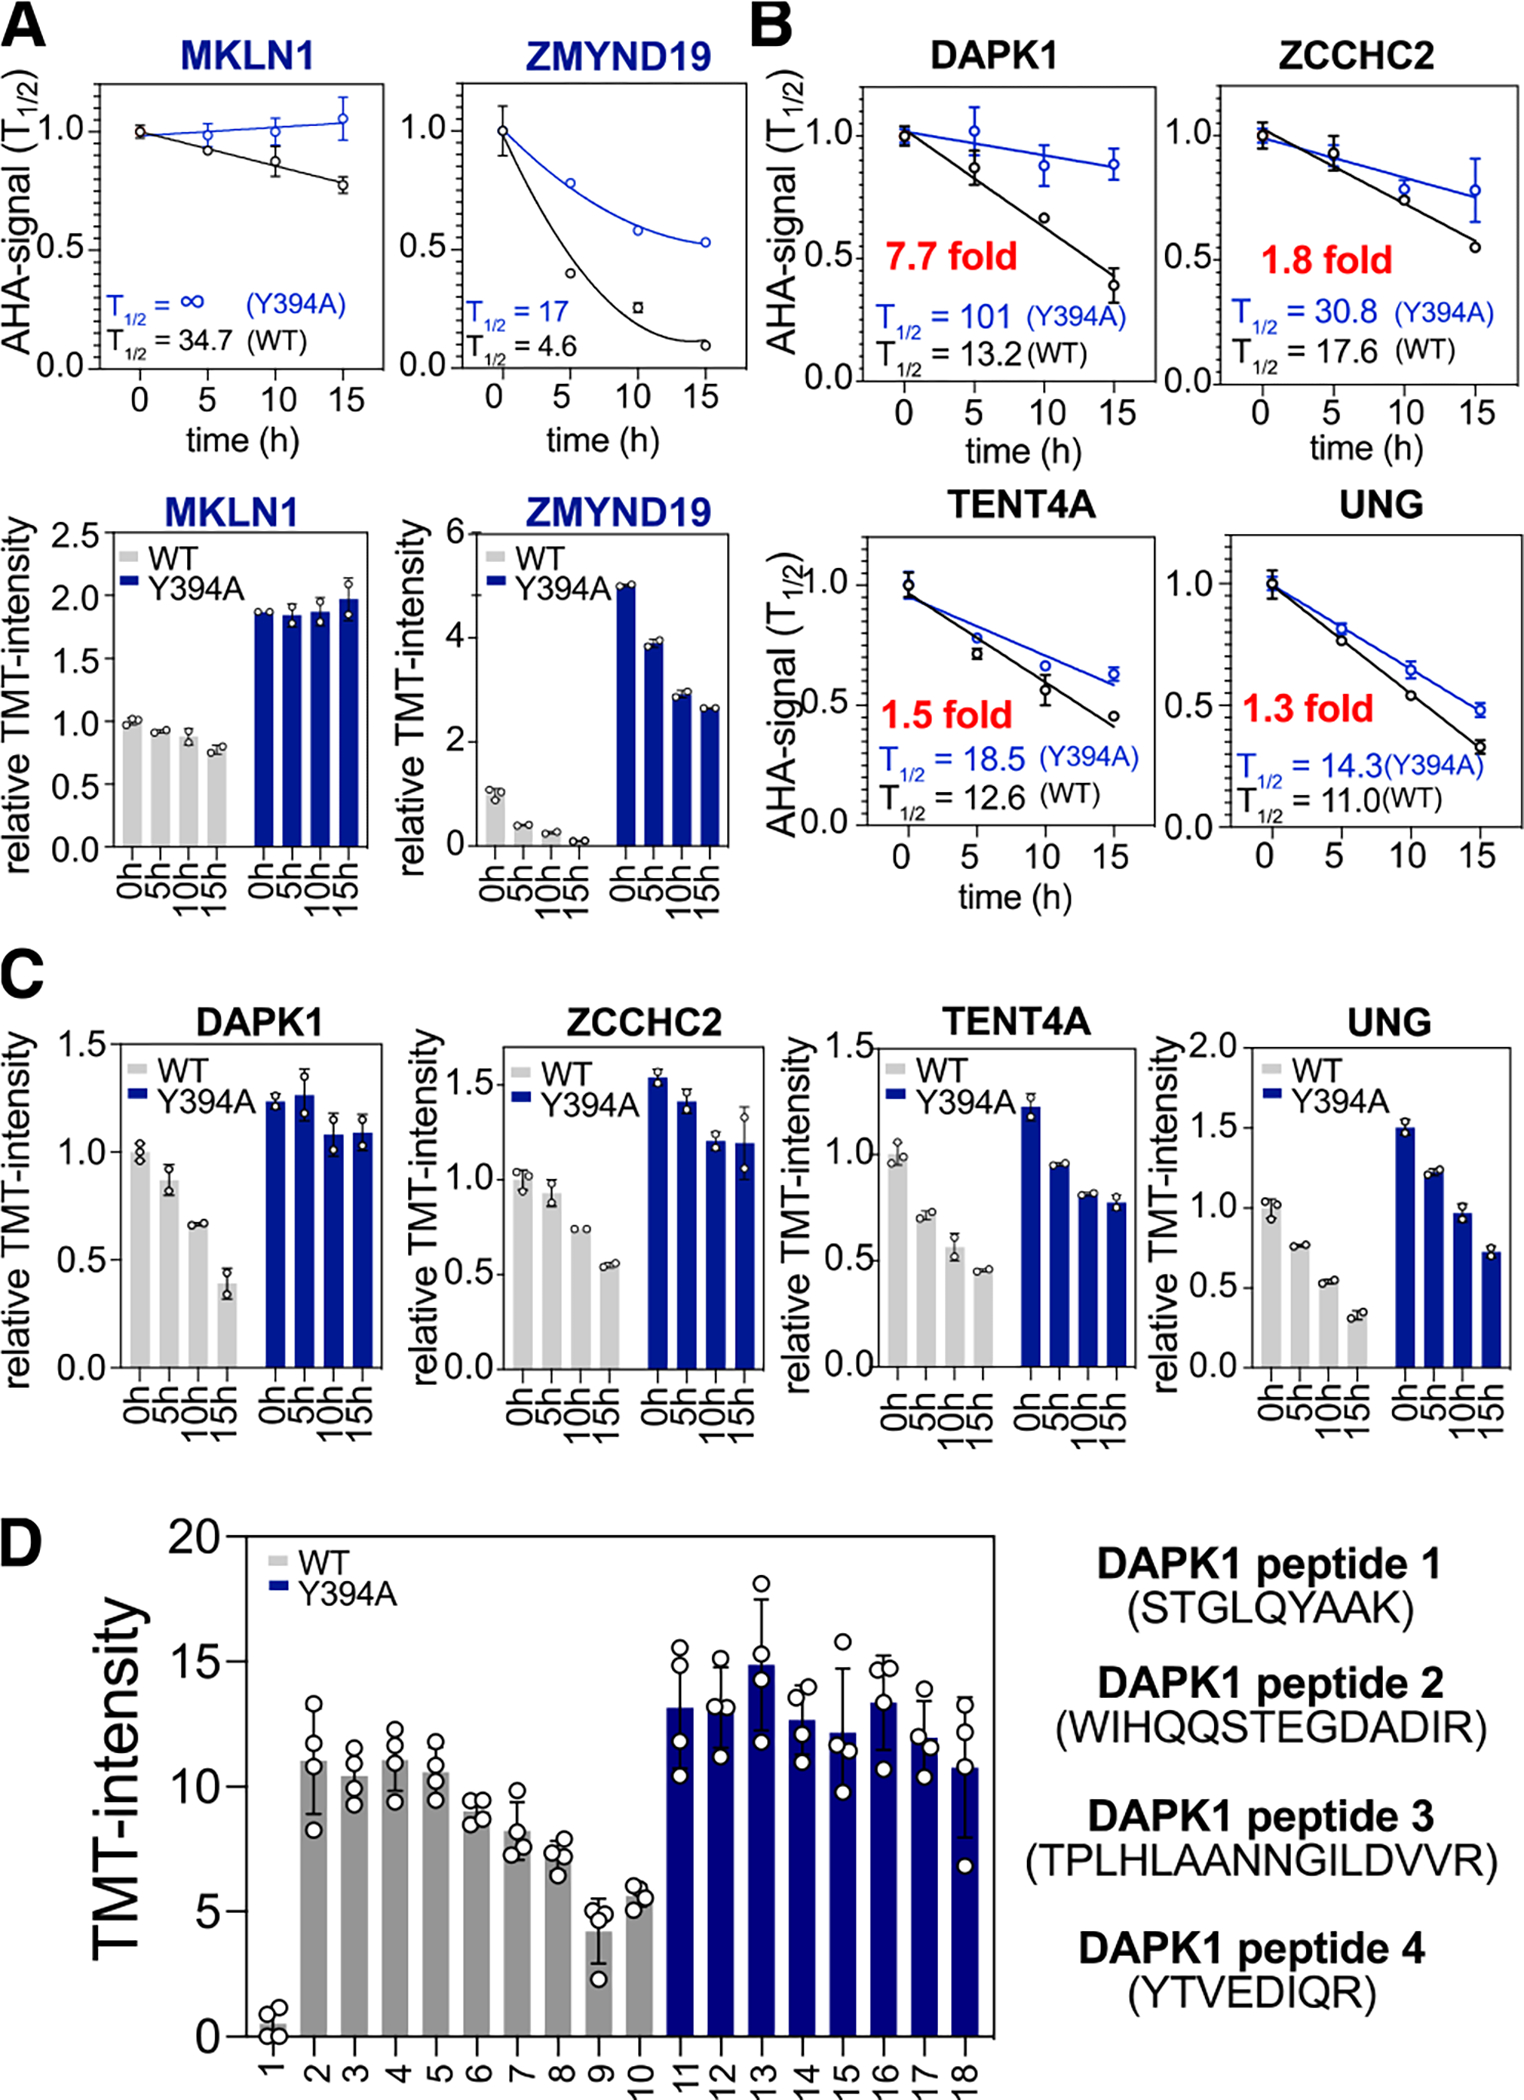
Figure 4.

(A) Degradation curves normalized for t=0 h for each cell line (top) and corresponding AHA-TMT signal bar graph normalized to t = 0 h of MAEAWT (bottom) for previously discovered substrates of CTLH E3 ligase. (B) Degradation curves for four newly discovered substrates. (C) AHA-TMT signal bar graphs for the new substrates. (D) TMT signal bar graphs for four quantified DAPK1 peptides.
