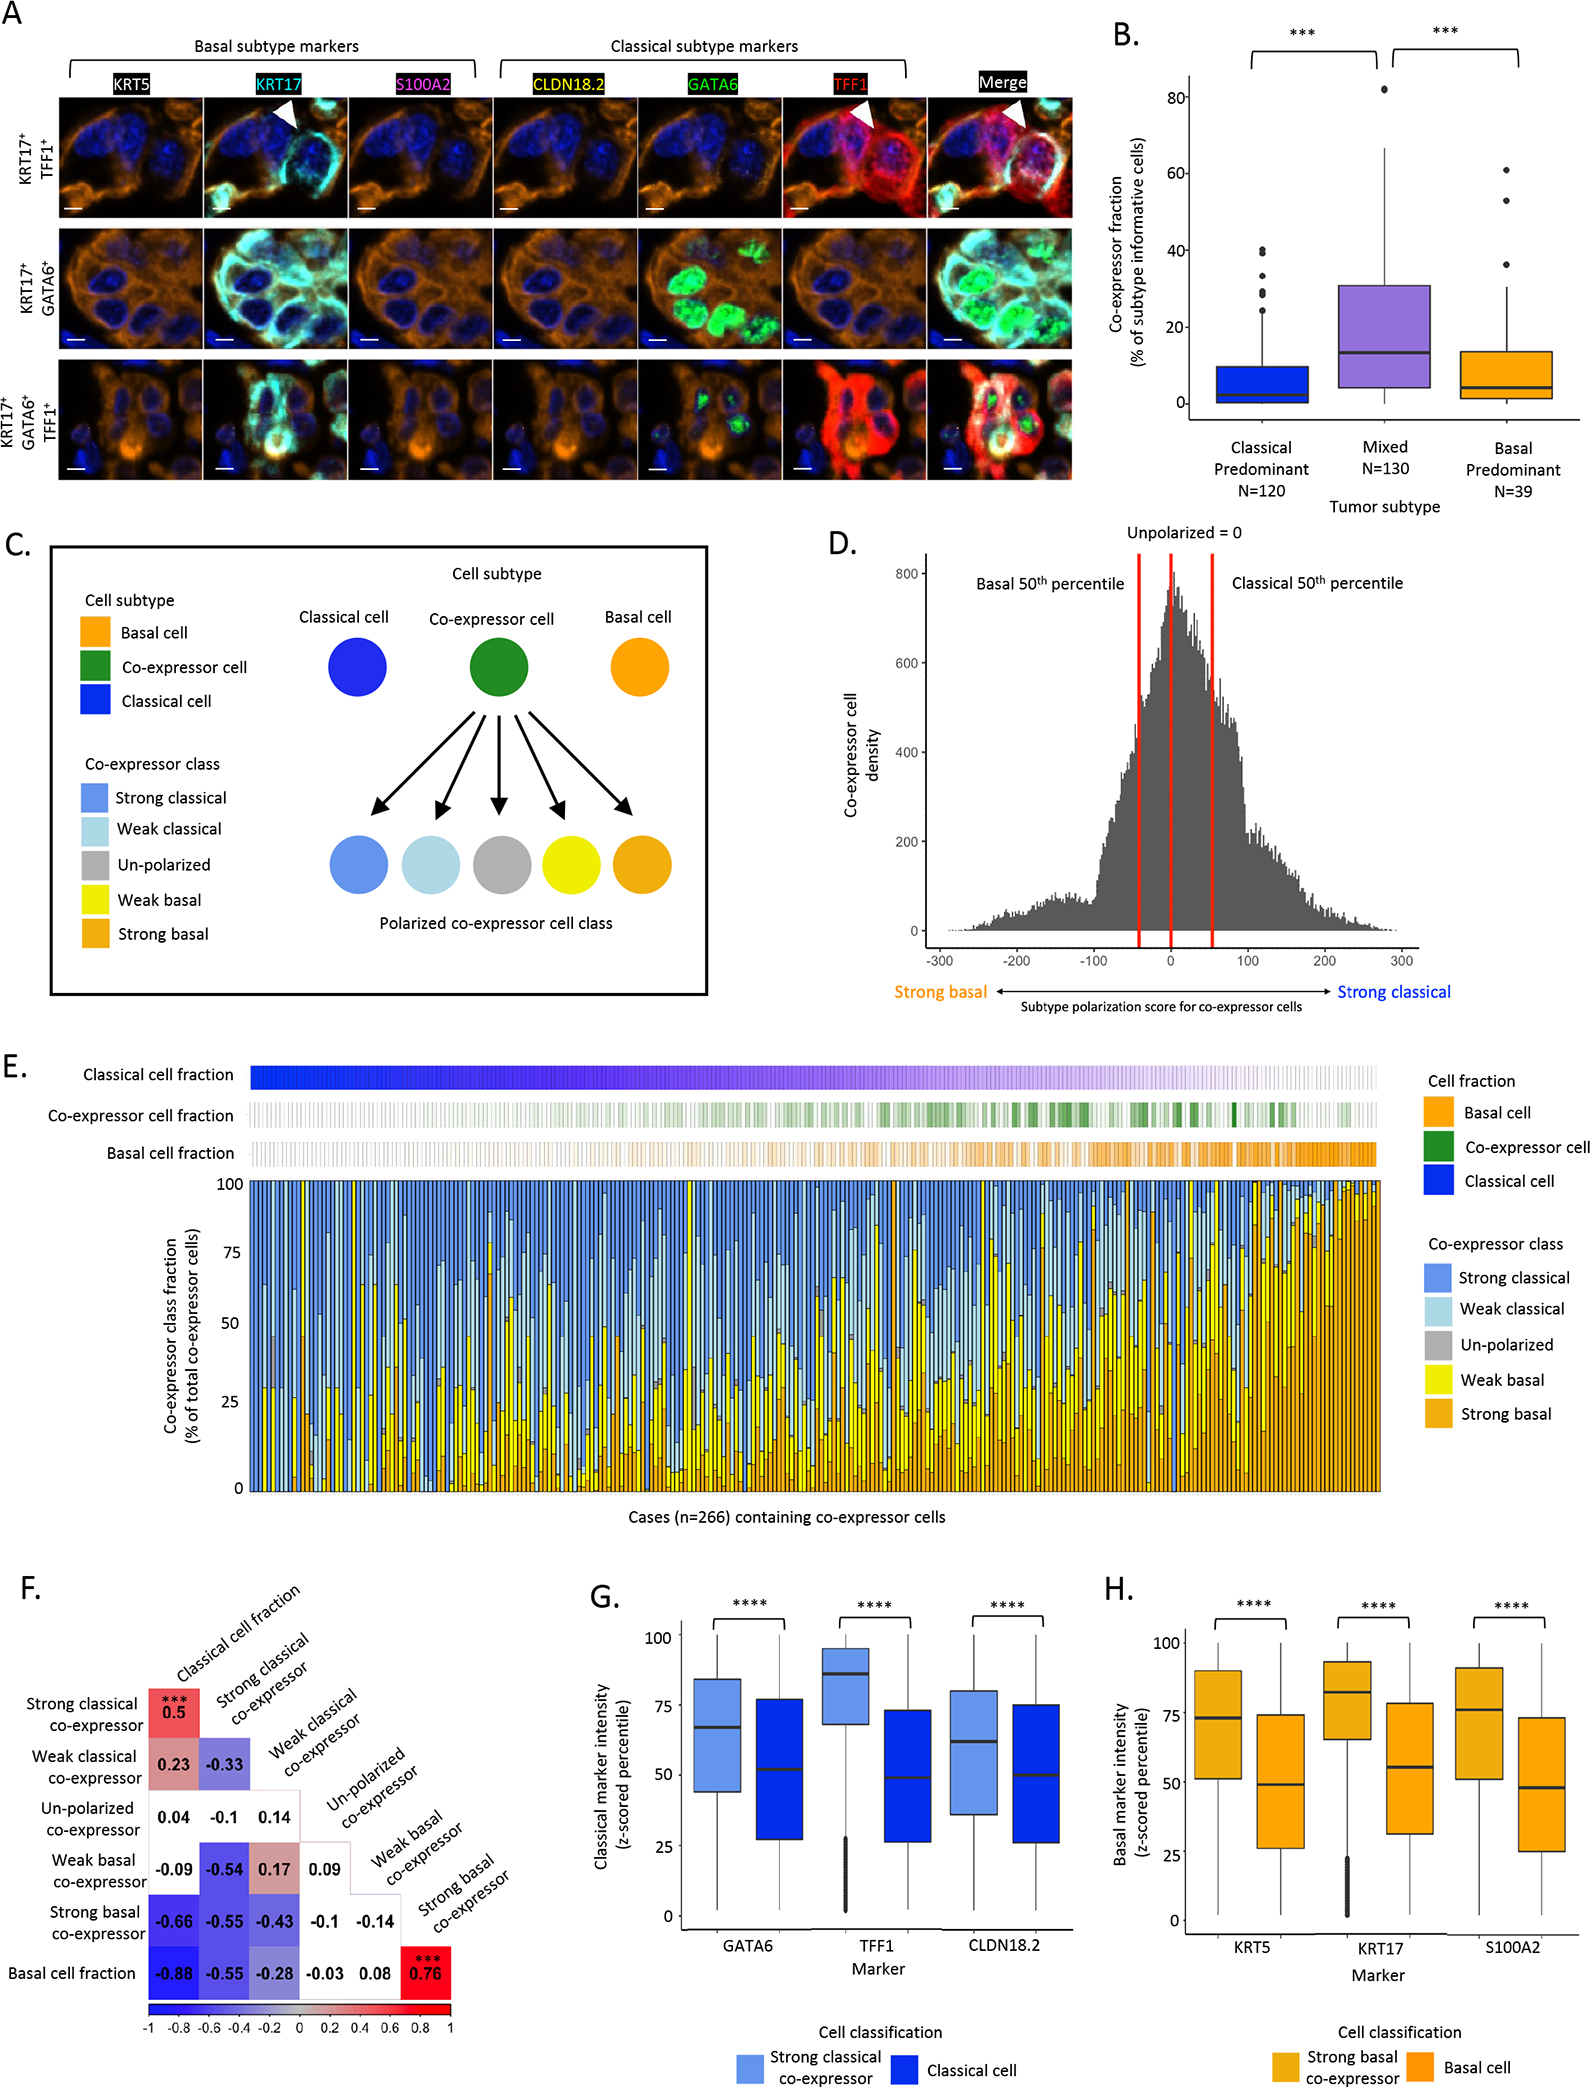
Figure 2. Single cell, protein-based expression subtype assessment identifies co-expressor cells that express classical and basal markers within the same cells.

A: Representative mIF images of the top three most prevalent co-expressor cell phenotypes. Top: KRT17+TFF1+, Middle: KRT17+GATA6+, Bottom: KRT17+GATA6+TFF1+. Scale bar = 5μm. B: Higher co-expressor cell fraction in mixed compared to classical-predominant or basal-predominant tumors (Chi2 test). C: Schematic of co-expressor cell polarization. Basal marker and classical marker expression intensities assessed to calculate a subtype polarization score in co-expressor cells. D: Histogram of subtype polarization score for co-expressor cells with class cut-offs depicted. E: Across 266 resected tumors, co-expressor cell polarization was highly heterogeneous, with strong basal or strong classical marker polarization scores enriched in tumors with high fractions of pure basal or pure classical cell fractions, respectively. Each column represents one tumor. F: Correlations between co-expressor polarization classes and pure classical and basal cell fractions. Strong basal co-expressor cell abundance was positively correlated with pure basal fraction (Pearson correlation R=0.76, P<0.001, strong classical co-expressor cell abundance was positively correlated with pure classical cell fraction (Pearson correlation R=0.5, P<0.001). G: Classical marker expression intensity in strong classical co-expressor cells and pure classical cells (Mann-Whitney test). H: Basal marker expression intensity in strong basal co-expressor cells and pure basal cells (Mann-Whitney test). *** p value significant at <0.001, **** p value significant at <0.0001.
