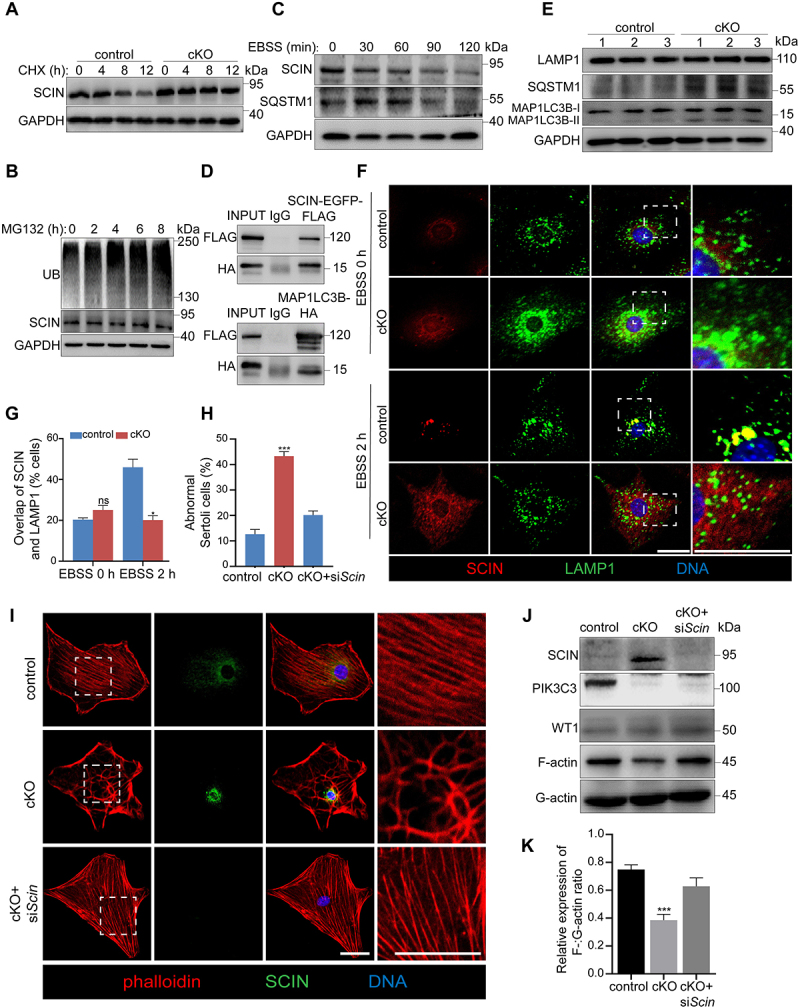
Figure 5.

PIK3C3 regulated SCIN degradation through the autophagy pathway. Primary Sertoli cells were isolated from control and cKO mice at 8 W of age. (A-C) Immunoblotting of SCIN in control and cKO primary Sertoli cells after CHX (A), MG132 (B) or EBSS (C) treatment. CHX (100 μg/ml) were treated for 12 h to measure the half-life of SCIN in control and cKO Sertoli cells. MG132 (10 μM), the proteasome inhibitor, was treated on control Sertoli cells for 8 h and cells were collected every 2 h to examine the UB (ubiquitin) and SCIN levels. Autophagy was induced by incubation of Sertoli cells with EBSS for 2 h to examine the protein levels of SCIN and SQSTM1, an autophagy marker. The expression of GAPDH was used as internal control. (D) Immunoprecipitation and immunoblotting showed the interaction of SCIN-EGFP-FLAG with MAP1LC3B-HA in HEK293 cells. (E) Immunoblotting of LAMP1, SQSTM1 and MAP1LC3B proteins in control and cKO Sertoli cells. The expression of GAPDH was used as internal control. (F-G) Immunofluorescence showing the overlap of SCIN and LAMP1 in control and cKO primary Sertoli cells after EBSS treatment (F) Bar: 30 μm. Graph showing the percentage of Sertoli cells with overlapped staining of SCIN and LAMP1 among all Sertoli cells on each cover slip (n = 3) (G). (H-I) the effect of SCIN on F-actin stabilization. Primary Sertoli cells were plated on cover glass slips and transfected with siCtrl and siScin, respectively. Immunofluorescence showed the reorganization of F-actin after knockdown of Scin in cKO Sertoli cells (H). Bar: 30 μm. Graph showing the percentage of Sertoli cells with abnormal F-actin cytoskeleton structure among all Sertoli cells on each cover glass slip. (n = 5) (I). (J) F-actin and G-actin from control, cKO or cKO+siScin primary Sertoli cells were segmented and analyzed by immunoblotting using an antibody against ACTB. (K) Graph showing the relative expression of F-:G-actin ratio in each group (n = 3). ***P < 0.01; ns, not significant.
