
Figure 6.
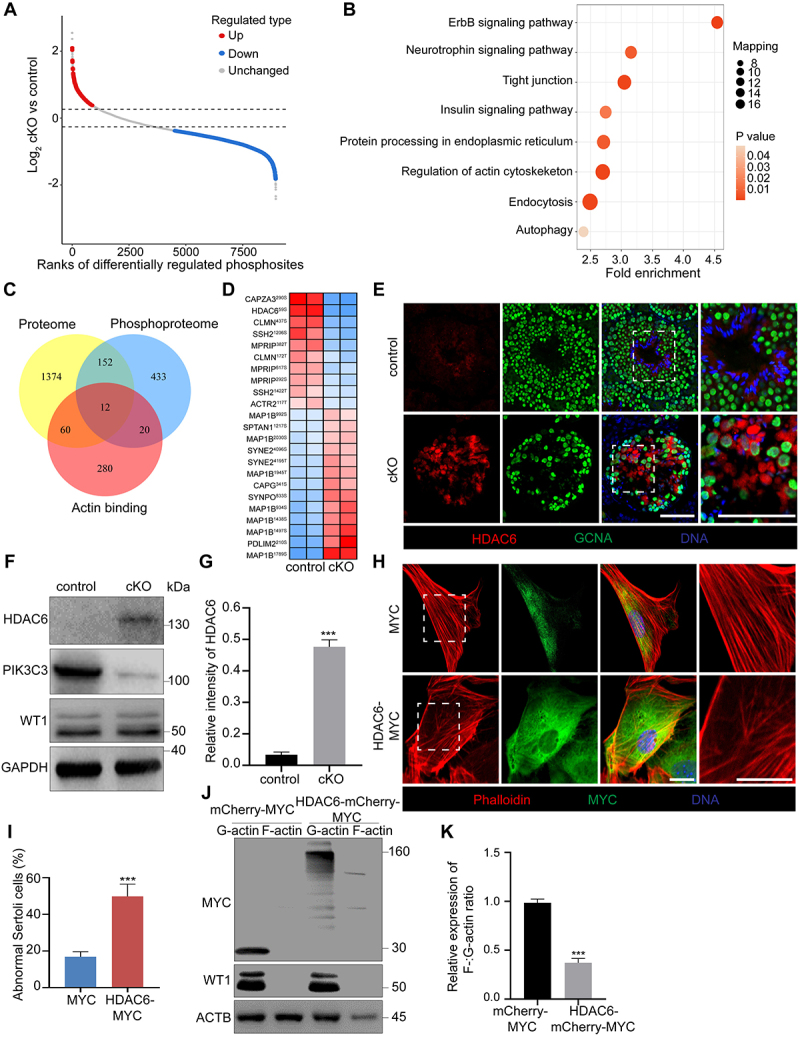
The accumulation of HDAC6 in Sertoli cells led to the disassembly of F-actin. Testes were collected from control and cKO mice at 8 W of age for TMT-labeled quantitative phosphoproteomics. (A) Scatter plot displaying differentially regulated phosphosites comparing control with cKO testes. Horizontal dashed lines indicate cutoff of log21.3FC (0.37851) and -log21.3FC (−0.37851). Red dots: upregulated phosphosites (FC ≥ 1.3; CV < 0.1). Blue dots: downregulated phosphosites (FC ≤ 0.769; CV < 0.1). Gray dots: unchanged phosphosites (0.769 < FC < 1.3; CV ≥ 0.1). FC: Fold Change; CV: Coefficient of Variation. (B) KEGG pathway analysis of differentially phosphorylated proteins. (C) the Venn diagram showing overlapped differential proteins revealed by TMT-labeled quantitative proteomics and phosphoproteomics and actin binding proteins. Twelve actin-binding proteins were identified as differential expressed in both protein levels and phosphorylated status between control and cKO groups. (D) Heatmap of twelve differential actin binding protein with identified phosphorylation sites. (E) Immunofluorescence for HDAC6 and GCNA in seminiferous tubules of control and cKO mice. Bar: 60 μm. (F-G) Immunoblotting of HDAC6, PIK3C3 and WT1 proteins in primary Sertoli cells collected from control and cKO mice at 8 W of age (F). The expression of GAPDH was used as internal control. The relative intensity of HDAC6 was shown as compared to the expression of GAPDH (n = 3) (G). (H-I) Disturbance of F-actin cytoskeleton after overexpression of HDAC6 in primary Sertoli cells. Primary Sertoli cells were plated and cultured on cover slips from the testes of male mice at 2 W of age. Cells were transfected with MYC and HDAC6-MYC. Immunofluorescence of phalloidin and MYC was performed (H). Bar: 30 μm. Graph showing the percentage of Sertoli cells with abnormal F-actin cytoskeleton structure among all Sertoli cells on each cover glass slip (n = 4) (I). (J- K) F-actin and G-actin from Sertoli cells were segmented and analyzed by immunoblotting using an antibody against ACTB (J). Graph showing the relative expression of F-:G-actin ratio in mCherry-MYC or HDAC6- mCherry-MYC overexpressed Sertoli cells (K). ***P < 0.01.